Featured Post

Beolover SyncDrive: DC Platter Motor Replacement for Beogram 4002 and 4004 (Type 551x and 552x)

Late Beogram 4002 and the 4004 (Types 551x and 552x), which have DC platter motors instead of the earlier synchronous AC motors usually suff...

Showing posts with label B&O. Show all posts

Friday, May 22, 2026

Beogram 8000 (5613): Installation of Redesigned Internal Beolover RIAA Pre-Amplifier

I recently redesigned my internal RIAA pre-amplifier for the Beogram 8000 and 8002 to feature a set of dip switches that allow choosing between amplified and non-amplified signal routing. That makes it possible to switch the pre-amp off if an equipped Beogram is moved from an amplifier without RIAA to an amplifier with a phono input. 

My previous design required removing the pre-amp board to accomplish this, and I thought this needed to change. All my other RIAA designs have this capability. The RIAA circuit is unchanged in this latest iteration, i.e. my previous in-situ measurements apply. Read here about my distortion and frequency response measurements on this design.

This shows the new board:

The main change from previous versions is the addition of a 6-position dip switch:

The above picture shows the switches set to 'RIAA'. Flipping all six returns the Beogram to its non-amplified configuration, and it could be plugged into any standard phono input.

In the following, I will discuss how to install the board. It connects directly to the solder points at the end of the ribbon cable that connects to the carriage. I usually mark the right channel with a black marker so I don't get confused when it is time to solder the wires to the RIAA board outputs:
For clarity, here is a snippet from the service manual showing the terminals of the ribbon cable:
The terminals at the bottom are the left and right outputs.
The first step was unsoldering the right and left output wiring and cleaning the solder pads with a desolder gun:
After removal of the mounting screw at the end of the ribbon cable assembly, I bolted the RIAA board in using the same screw and positioned it to overlap with the four solder pads of the output cables. Then I put a small amount of solder into each of the 'connection vias' of the board to make the connections between the RIAA inputs and the ribbon cable terminals:
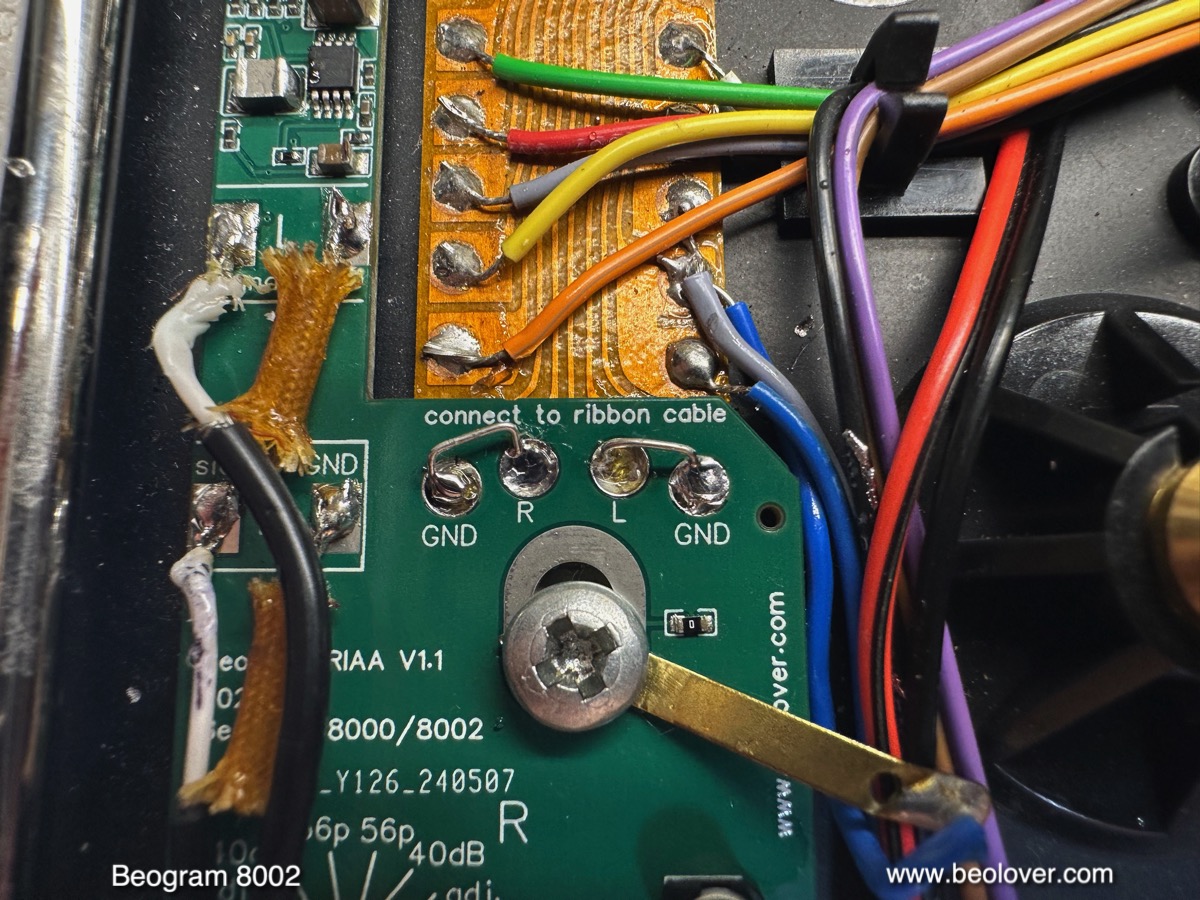
The next step was to connect the L and R wires to the respective output terminals of the RIAA board:
I replaced the original woven insulation of the shield braids with modern shrink tubing (black) for a cleaner look.
The final part of the installation was connecting the RIAA board to its power supply.
Unfortunately, there is no power connected at the end of the ribbon cable, i.e. a separate wire needs to be installed to the 15V regulator. I connected a wire to the "15V" solder pad of the RIAA:
Note that the 15V label corresponds to the minimum voltage the RIAA needs for proper functioning. The maximum voltage allowed is 36V for this design. The next step is routing the wire to the voltage regulator PCB next to the front rod of the carriage. I recommend routing the wire along with the other wires beneath the subplatter. The critical routing points are labeled yellow in the photo below:

By feeding the wire under the plastic clips that hold the other wiring in place, it reliably avoids chafing with the sub platter. This shows the first of the clips (counted from the RIAA board):
And this the second when the wire emerges from underneath the subplatter:
This is how these two spots look with the subplatter installed:
The wire terminates at the input terminal of the TIP32 (0TR1) voltage regulator of the 15V rail. This terminal connects directly to the rectifier and main capacitor of the 15V rail and usually carries about 23V. I soldered the wire to the terminal, and this concluded the installation of the RIAA board!:
And then it was time to enjoy this redesigned RIAA pre-amp! I plugged the Beogram into the tape input of my amplifier and put on one of my favorite records, "Very Tall" by the Oscar Peterson Trio with Milt Jackson. This record was released in 1962 on Verve Records. I appear to have a re-issue from 1982 (UMV 2026).
Beolovely! This Beogram is now ready to be used with pretty much any modern amplifier or 'device' that still has a wired line-in!


Saturday, August 3, 2024

New Internal RIAA Pre-Amplifier for Beogram 8000/8002 - Installation and Characterization

I was recently offered a nice looking Beogram 8002 from a gentleman in Oregon. After I received the unit I decided to restore it and while I had it opened up on the bench, I thought it would be a good moment for adapting the Beolover RIAA pre-amplifier design for this type Beogram. The 8000 series is popular among B&O collectors due to its unique linear induction platter motor, which drives the platter directly without any mechanical contact.

This shows the new Beolover RIAA pre-amplifier design:

I had to dramatically reduce the circuit dimensions due to the much less open interior space of the Beogram 8000 series. The design uses the exact same amplifier circuit I designed for my initial 400x pre-amplifiers, but the power supply is adapted to work with the 15V system of the Beogram 8000 series.
Implementation of this board requires opening up the Beogram. It is best to put it into 'service position', i.e. remove all significant components from the enclosure and set everything up on the bench:
This enables easy access to the ribbon cable that connects the output wiring to carriage and tonearm. This shows the end of the ribbon cable in its original state. The two left and right output cables are soldered to terminals on the ribbon end:
After removal of the wiring, a pattern of 4 circular solder pads is revealed:
The Beolover 800x RIAA pre-amplifier is soldered directly to these pads. It also bolts in mechanically using the bolt that connects the Beogram wiring to chassis:
The power connection to the board unfortunately requires routing a wire from 0TR1 that makes the stabilized +15V supply. This shows 0TR1 next to one of the carriage rods
The orange wire that connects to the emitter of this pnp TIP32 transistor carries about 21.3V from the rectifier. This voltage is used to power the RIAA board. The thicker red wire that is soldered to the solder terminal of the orange wire in the picture above is routed to the RIAA board and soldered to its 15V (min) terminal (see picture above).

After this fairly straight-forward installation, I characterized the circuit. Since the amplifier section of the board is identical to the version for the Beogram 4002 and 4004 series, I will only discuss the noise characterization here, which is specific to the Beogram 8000 series. The amplification and RIAA de-emphasis data is identical to what I discussed earlier in the post about the original 400x design.

When considering internal RIAA pre-amplifier designs the amount of electromagnetic interference (EMI) and back EMF from the platter motor leaking into the amplified signal is the most important quality factor after the performance of the pre-amplifier itself.
Since motors are notorious for feeding back voltage ripple into the power rails of their supply, it is necessary to take special precautions when designing an internal pre-amplifier that shares its power supply with a motor. RIAA preamps have their maximum gain of around 60dB in the lower frequency range due to the fact that lower frequencies are encoded at smaller amplitudes in the record grooves.
60dB corresponds to a 1000x voltage amplification. Unfortunately, platter motors usually generate voltage variations in exactly this low frequency range, i.e. even the smallest motor related voltage ripple can become very audible in the audio output signal if the amplifier supply is not carefully separated from the main supply of the turntable. As an example, a small 1mV motor ripple in the amplifier supply voltage could result in a 1V output ripple at 60dB amplification! This would be about the same volume level like that produced by a loud section on a vinyl record.

Characterization of the noise performance of the Beolover internal RIAA pre-amplifier for Beogram 8000 and 8002:

I used a QuantAsylum QA400 audio analyzer for these measurements. The QA400 is a predecessor of the currently sold QA403. The QA400 is essentially a very sensitive analog to digital converter (ADC) that is matched with software that can show a Fast Fourier Transform (FFT) of the audio signal. The resulting 'FFT spectra' essentially show the amplitude of individual frequency components of an audio signal plotted on the frequency axis. A simple example would be the FFT of a perfect undistorted 1 kHz tone. The FFT spectrum of this signal would be a single peak at the 1kHz frequency.
When measuring noise spectra with such a device, one gets spectra that show all the different frequency components of the noise. Ideal 'white noise' would yield a spectrum that has the same amplitudes for all frequencies, i.e. one would get a horizontal line above the frequency axis.
Real life situations are usually more complex and this brings us to the graph below:

This graph contains FFT spectra measured at the output of the Beogram 8002 deck before and after installation of the RIAA pre-amp board.
All five spectra were measured with the arm down and the platter running. In other words in the situation one encounters when playing a record.

The green spectrum at the bottom was measured before installing the RIAA pre-amp, i.e. represents the situation found in an Beogram 8002 in its original factory condition. The signal from the cartridge goes directly into the DIN7 output plug without any electronic circuitry in-between. Therefore the noise seen in this spectrum is purely related to the Johnson noise coming from the cartridge coils and the wiring hooked up between the cartridge and the QA400 audio analyzer, plus any EMI from external sources. The peak at 60 Hz is related to the EMI coming from the power system around the house where I did these measurements. It is very difficult to get rid of this peak in practical terms since this type of EMI is omnipresent in the environment and so would require complete Faraday shielding of the measurement setup. Luckily in FFT spectra one can easily identify it and then ignore it as a measurement artifact.

It is more interesting to look at the other end of this spectrum, where we see a number of small peaks. These peaks seem unique to the Beogram 8000 series since I did not see them in the corresponding spectrum measured when I characterized the original Beogram 4002/4004 version of this amplifier design.
While it is difficult to determine the origin of this noise signal with 100% certainty, my hypothesis is that it is interference from the linear platter motor. This motor is much more exposed than the fully shielded DC platter motors of the earlier Beogram 400x series and so it seems likely that these peaks are caused by EMI from the drive system.
This EMI seems to couple into the output signal via the traces on the ribbon cable that connects the tonearm wiring to the terminals where the output wires are connected. This ribbon cable is a mechanically elegant solution enabling carriage motion while maintaining wire connections, but is not shielded at all. In comparison the preceding 400x series Beograms bring shielded wiring right up to the base of the tone arm before it becomes exposed. This may explain the more quiet spectrum I measured for the 400x.

This hypothesis is supported by the measurement results on the RIAA pre-amp shown above the green spectrum. The first spectrum I measured (brown) was measured with the RIAA board soldered in, but the inputs connected directly to GND with small wire bridges. This is shown here:

This measurement allowed characterizing the noise that is contributed by the amplifier itself, since the signal at the inputs is 0V (GND). This is a common approach for testing the noise background of amplifiers.
Let's have a look at the spectrum. It basically replicates the low frequency peaks already seen in the green spectrum, which are measurement artifacts, but it does not show any of the high-frequency peaks seen in the green spectrum. This means that these spectral components in the green spectrum really come from 'before' the RIAA amplifier, i.e. from the wiring between cartridge and amplifier input.
This is clearly supported by the next spectrum (red) that was measured after removing the GND jumpers. In this case the signal from the cartridge was directly fed into the amplifier, and the amplifier duly amplified the noise.
In fact, when connecting the Beogram output to my amplifier, I was able to hear a weak noise signal from the speakers when turning up the volume to maximum. Music at this level would certainly have alerted our neighbors...;-). I.e. for all practical purposes this is a very weak noise signal that needs a lot of amplification to be audible. But the FFT spectrum mercilessly shows it in a fairly dramatic way!

To further characterize the significance of this EMI noise I did two more measurements, this time using  'Ultimate Analogue Test LP' from Analogue Productions. This test LP allows doing FFT measurements under actual vinyl record playback conditions. The blue spectrum in the graph was measured while playing Track 6 on Side 2 of this record ("Silent groove for bearing rumble and table isolation"). This track is a simple smooth V-groove without any encoded audio signal, i.e. it mainly produces vinyl groove surface noise (and of course a few klicks and pops). This essentially gives us the noise floor of a well-manufactured record. We see here that the blue spectrum has a considerably higher noise level than the red spectrum. The EMI noise only very weakly peaks through in this spectrum, i.e. it basically blends into the vinyl surface noise. I was not able to discern it anymore from the vinyl noise when listening to the track via my amplifier, even at very high volumes.
The final (black) spectrum in the graph was measured on Track 1 on Side 1 of the record, the "1kHz reference tone", which basically simulates actual listening conditions. This spectrum is dominated by a singular peak at 1 kHz, accompanied by its harmonics towards higher frequencies. These harmonics are mainly caused by distortions in the cartridge, which are typically around 1% (the amplifier itself has only about 0.012% harmonic distortions).
More interesting for this discussion is that the surrounding noise spectrum is even higher than the pure vinyl surface noise and in this spectrum the EMI noise is completely drowned out by noise coming from the 1 kHz track.

After this analysis it was time to enjoy this restored Beogram 8002 and just listen to some nice music. I selected one of my favorite records, "House Boat" by Volker Kriegel, which he recorded for the MPS (Music Produziert im Schwarzwald) label in 1978 (MPS 15.535). In my opinion one for the best Kraut Jazz records of all times. Maybe one of the best jazz records overall (I know...beauty is in the eye of the beholder...;-).
Anyway, a perfect record for a Beogram that originated from the early 1980s! Of course this record was cleaned ultrasonically before play with a CleanerVinyl ProXL setup to bring out its full analog vintage glory!
Here is an impression of the setup!...I always like playing the 800x turntables in their service position. Almost looks like one of those Very Expensive Modern Designs!...;-)

This sounded all very well! A pretty happy result. This Beogram can now smoothly be integrated with more modern B&O systems that do not have a phono input anymore.
This Beogram will need to remain in service position a little longer. I am working on one more upgrade, which I am hoping to feature soon in another post.


Friday, March 6, 2015

Beocord 5000 (4715/4716): Installing Rebuilt Rubber Pinch Rollers

Extensive tests of the Beocord 5000 (4715/4716) that I rebuilt recently (links to the relevant blog entries) revealed that occasionally, under certain conditions (air humidity in the 60% range and/or low room temperature below ~65F), the leading capstan would stop advancing the tape, with the unwanted consequence that the feed-in capstan would push the tape out into the space between the erase head and the feed-in pinch roller. Luckily, the auto-stop feature of the Beocord reacts fast enough to catch this happening before the tape gets damaged. One of these events is demonstrated at the beginning of the video below. 

Experimentation revealed that pressing the leading pinch roller slightly towards its capstan with a finger solved the issue. Cleaning of the roller and capstan did not help much. And since the spring that controls the roller pressure looked pristine and its adjustment nut showed an intact B&O applied red paint spot, I came to the conclusion that most likely the rubber of the pinch roller had hardened, reducing the friction, causing occasional loss of transport. It is important to note here that the tape is transported forward by the friction between the roller and the tape, and not by friction between the capstan and the tape. The capstan only drives the roller via contact above and below the tape.

I searched a bit around on the web trying to find replacement pinch rollers for the Beocord, but to no avail. The issue is that the rollers have a fairly 'rare' diameter of 10.8 mm, which apparently was not used by any of the major tape mechanism manufacturers. It seems that most pinch rollers that were used back then were 1/2 inch. But surfing around on some 'tape heads' web sites and message boards soon yielded the name Terry Witt, who appears to be the only person on our planet who professionally rebuilds classic tape pinch rollers. I read some positive reviews about his work, and so I decided to get in touch. After a short email forth and back, I decided to extract the rollers of another Beocord that I had in my closet and sent them to him for rebuild. I was very pleased by the results! Here is a picture of the rebuilt rollers together with his business card:


The main challenge with the roller rebuild is to extract them from the Beocord's roller arms. Essentially, one needs to use a vise or press to push out the pins on which they run. Nothing for the faint of heart, but definitely doable. I made a YouTube video about the process:


I tested the deck by now for a few hours after inserting the rebuilt rollers, and everything seems to work great now. But I will only believe it after another couple weeks of testing...one realizes that mechanical issues are where the challenges lie with these old vintage units!

Friday, January 30, 2015

Beocord 5000 (4715/4716): Test Drive

A happy day! The second Beocord 5000 (4715/4716) is back together and is playing happily with its friends, the Beomaster 6000 4-Channel and the Beogram 4002. I decided that the soundtrack of 'Alfie' by Sonny Rollins would be a nice celebratory first recording:


Alfie is definitely one of my favorite Michael Caine movies, and the sound track is just awesome! Here are some impressions of the recording session:


Sunday, January 25, 2015

Beocord 5000 (4715/4716): Polishing the Plexiglass Cover

My current Beocord 5000 (4715/4716) restoration is coming to an end. Today, I polished the plexiglass cover, which came out fairly nicely. I followed the procedure outlined earlier. Here is a picture of the outcome (it still 'wears' the protective tape to shield the back part of the panel from the polishing process):


Sunday, January 18, 2015

Beocord 5000 (4715/4716): Calibrating Recording Current and Bias

Happy that the Beocord 5000 (4715/4716) tape mechanism seemed to work, I made a first test recording using my waveform generator. When playing back the tape, I realized that one of the channels was off by about 3 dB on the Peak Program Meter (PPM). This meant that the calibration of the deck was off. Not a surprise, considering the age. I guess this also meant that I was just lucky with the first Beocord 5000 that I rebuilt for my Beolab 6000 set-up, which performs admirably without doing a thorough calibration. Anyway, I felt that the first step towards a solid calibration would be to get a reliable 'frequency response' measurement in place. Frustratingly, none of my bench equipment offered anything useful in this direction. I looked around for free software that would let me do such measurements with my computer (the audio range is quite unchallenging to modern sound cards in PCs).

I was not able to find anything open source that would enable such measurements without too much hassle. But I finally found the 'audioTester', which was written by an enthusiast (Ulrich Müller) in Germany. He offers an evaluation shareware version that allows to do measurements for 10 min before a restart becomes necessary. I downloaded this version onto my old MacBook Pro that I use as my go-to Windows 7 PC in Bootcamp mode whenever I need to use PC-only software. The installation went well and the built in sound card of the MacBook seems adequate for the task. After a bit of experimentation (the owners manual is a bit scant) I was able to make a non-synchronized sweep-measurement to determine the frequency response. It needed to be a non-synchronized measurement since the 2-head Beocord does not offer a monitor function for listening to the recording during the recording process. During a non-synchronized measurement the software determines the frequency of the sound and plots the signal level relative to the measured frequency. This means that for a response measurement, one needs to record a sine wave sweep across the entire spectrum (I did a 60s logarithmic sweep from 10-20kHz), then rewind the tape and during playback the measurement is done. I tested the mechanism by directly feeding the 60s sweep from my waveform generator into the audioTester. The measurement yielded a constant level across the entire spectrum, indicating that the signal path through the MacBook sound card was linear.

After this I did a baseline measurement of the Beocord at 0dB. This requires to adjust the signal level for recording in a way that the Dolby B ICs put out 740mV(RMS) signal at their pin 7. This can be achieved by setting the waveform generator to an amplitude of about 50mV(pp) and using the recording level potentiometer to adjust the recording level to 740mV(RMS) at pin 7 on both ICs for left and right signal path. Dolby should be switched off during calibration.

Here is a shot from my oscilloscope of the 0dB signal at pin 7 at 333kHz (the pp voltage of 2.3V is 0.2V too high due to noise). The RMS voltage is shown at the bottom right corner of the screen.:


Oscilloscope probe at pin 7 of the Dolby B IC for the right channel: 


After recording the sweep, the payback yielded this frequency response curve:


I was still in the learning process with the 'audioTester, which is the reason that the curves only start at 100Hz, but it is obvious that for high frequencies there is a several dB difference between the channels. This explains the discrepancy on the PPMs during playback.
So I set out to do a calibration. I followed the procedure outlined in the service manual. This procedure first adjusts the recording current that playback and recording signals are the same at pin 7 at 333Hz. This adjustment is done for a medium signal level of 200mV(RMS) at pins 7 of the Dolby ICs. The recording current is adjusted with the trimmers 1R99/47 for CrO2 tapes (I used a TDK SA 90). 
So the first step is to adjust the Dolby B output to 220mV(RMS):
The procedure to get the right adjustment is simply to make a recording, play it back and monitor the signal at pins 7. If the signal is too high turn the respective trimmer (L or R channel, and tape type)clockwise, if it is too low, counter clockwise. Repeat until about 200mV are achieved during playback. The trimmer adjustment is pretty sensitive, i.e. small steps (~5 degrees) are advised. On this pic I am adjusting the left channel during the calibration for a Fe2O3 tape:


Once the recording current is adjusted properly, it is time to do the 'bias' adjustments. This adjustment sets the amplitude of the 92kHz bias signal that is fed into the erase head. This signal needs to be of perfect amplitude that high frequencies can be recorded properly. The amplitude of the bias signal is adjusted with trimmer capacitors that tune the resonance frequency of a pickup coil that takes the signal up from the bias oscillator.

The procedure for this adjustment is as follows: Set input signal to 333Hz and 22mV(RMS), adjust record level potentiometers that you get 740mV(RMS) on pin 7 of the Dolby ICs. Now reduce the amplitude of the input signal by a factor 20 (-26dB) to 1.1mV (RMS). If the PPMs are calibrated right, only the lowest lamp should be on for each channel. Now set the input signal to 15kHz and adjust the bias trimmers for both channels (C70/72 for CrO2, and C71/73 for Fe2O3) that during playback the same -26 dB signal is seen at pin 7  (37mV RMS) as during recording. Here is a picture when I adjusted the right CrO2 trimmer:

Unfortunately (if one does not have the special tool that fits into the trimmers from the solder side of the PCB - I might 3D print myself one someday...;-), one needs to lift the preamplifier PCB every time an adjustment is made, while the recording requires the board in place that the recording switch can be activated by the solenoid, and that the board is properly grounded. Hence, this is a bit an annoying process. Also the trimmers are very sensitive, i.e. there are a few adjustment cycles to go through until the bias is adjusted properly. 

After the calibration was done for both tape types I measured the frequency response again with the audioTester. Here are the results (I compiled them into Excel graphs for both tape types):


It is remarkable that there is little difference between the two tape types. This is probably a testament to the quality of modern Fe2O3 tape materials. As to be expected the low level (-20dB for CrO2 and -26dB for Fe2O2) are much better at high frequencies than the 0dB curves and reach smoothly to 15kHz. This difference between low and high levels is a common trait of all tape recorders. It is also nice to see that the Dolby B system does not seem to introduce significant distortions. The curves are almost indistinguishable from the non-Dolby curves.

It is interesting to compare these curves with some curves of high quality 3-head decks that are posted online. These curves show a surprising wide range of curve shapes, some even with oscillatory features in them. It seems that the Beocord 5000 holds its own, especially when considering that the measured 3-head decks are all much more 'younger', and that all have a monitor function, i.e. the response was measured during the actual recording process, which optimizes tape positioning etc...


Monday, January 12, 2015

Beocord 5000 (4715/4716): Calibrating the Peak Program Meters (VU Meters)

I put the Beocord 5000 (4715/4716) back together. It seems to work now. I made a recording using a signal my waveform generator, and it seems the playback is undistorted across the frequency range and at a reasonable level. So I started to do some measurements to check if the deck is within spec. Before getting into measurements like frequency response etc...I thought it would make sense to start with calibrating the "Peak Program Meters" (PPM) as the meters are proudly called in the service manual. Seems fast electronic audio level meters were something new in consumer units back then in 1978...I studied the service manual to get some advice for their calibration. The manual suggests to directly feed 300 Hz from the waveform generator into the input of the Dolby B ICs, and then do the adjustment of the PPMs.

I chose a slightly different path and simply fed a 300Hz 25 mV amplitude (not pp) signal into the inputs of the Beocord, switched the deck into 'record' (paused), and then used the recording level meters to adjust each of the channels to get the prescribed 740 mV RMS at the outputs of the Dolby B ICs (pin 7). This can be measured with a multimeter switched to AC. This will give the RMS voltage of the AC signal. Once the 740 mV RMS are at the output, the trimmers for the PPMs can be adjusted for 0 dB (first red light).
Here is a pic of the part of the Operation Control PCB (#2) where the trimmers are located:


The two larger trimmers are for the 0 dB adjustment. Instructed by the service manual, I adjusted them until the 0 dB lamps just lit up. The next step was to do the -25 dB adjustment. This calibrates the slope of the meter. This adjustment requires to lower the output signal at the Dolby B ICs to -20 dB relative to the 0 dB 740mV RMS signal. -20 dB corresponds to a factor 10 of the amplitude of the signal, i.e. I adjusted the record level sliders to get 74 mV amplitudes at the Dolby B outputs. The service manual prescribes to adjust the -25 dB trimmers in a way that the -25 dB lamps just light up. Not sure why they recommend to get the -25 dB lamps to light up, and not the -20 dB ones, considering that the signal level was lowered by 20 dB...anyway, I decided to stick with the service manual, and did the adjustment. Then I did the 0 dB adjustment one more time (as suggested by the manual). After this adjustment I can now trust the meters, which sets the foundation for a successful frequency response measurement.


Thursday, January 8, 2015

Beocord 5000 (4715/4716): Recapping the Power Supply, Motor Control, Electronic Switch and Operational Control Boards

And the recap continues! Today I did the remaining electrolytic capacitors of the Beocord 5000 (4715/4716) that sits on my bench right now. Always feels great when all the electrolytics are new! Piece of mind!
The remaining boards were the power supply including reservoir caps and the AC motor cap, motor control, electronic switch and operational control boards:

This is a shot of the Motor Control board that controls the take up motor. Only one Tantalum capacitor to replace:
After replacement:

Here is the Electronic Switch board that manages the keyboard and houses the counter and tape transport monitor. A picture before the recap:

On to the Operational Control PCB. Before:
and after:
Below is a picture of the two recording volume sliders underneath the Operational Control board. I just love this type of B&O 1970s solution. Basically an analog version of digitally simulated sliders on a touch screen...;-). The two red strips are pushed into a white lit compartment underneath the plexiglass cover. This gives the illusion of a linear indicator that gradually changes from white to red as the sliders are pushed to higher volume. The toothed racks drive the potentiometers on the Operational control board that actually take care of the recording volume adjustment:


And finally the pictures of the power supply. Only one electrolytic capacitor directly on the board. Before:
and after:

The power supply has several external reservoir capacitors. This is the 1 uF capacitor on the +12V regulator. Before:
and after:

And the main reservoir capacitors of the power supply together with the AC motor cap. Before:
And after. The two small back-to-back polar 33uF capacitors replace the original bipolar 16uF capacitor on the capstan AC motor:

I guess now it is time to put everything back together for a test! Exciting!