Featured Post

Beolover SyncDrive: DC Platter Motor Replacement for Beogram 4002 and 4004 (Type 551x and 552x)

Late Beogram 4002 and the 4004 (Types 551x and 552x), which have DC platter motors instead of the earlier synchronous AC motors usually suff...

Showing posts with label measurements. Show all posts

Friday, May 22, 2026

Beogram 8000 (5613): Installation of Redesigned Internal Beolover RIAA Pre-Amplifier

I recently redesigned my internal RIAA pre-amplifier for the Beogram 8000 and 8002 to feature a set of dip switches that allow choosing between amplified and non-amplified signal routing. That makes it possible to switch the pre-amp off if an equipped Beogram is moved from an amplifier without RIAA to an amplifier with a phono input. 

My previous design required removing the pre-amp board to accomplish this, and I thought this needed to change. All my other RIAA designs have this capability. The RIAA circuit is unchanged in this latest iteration, i.e. my previous in-situ measurements apply. Read here about my distortion and frequency response measurements on this design.

This shows the new board:

The main change from previous versions is the addition of a 6-position dip switch:

The above picture shows the switches set to 'RIAA'. Flipping all six returns the Beogram to its non-amplified configuration, and it could be plugged into any standard phono input.

In the following, I will discuss how to install the board. It connects directly to the solder points at the end of the ribbon cable that connects to the carriage. I usually mark the right channel with a black marker so I don't get confused when it is time to solder the wires to the RIAA board outputs:
For clarity, here is a snippet from the service manual showing the terminals of the ribbon cable:
The terminals at the bottom are the left and right outputs.
The first step was unsoldering the right and left output wiring and cleaning the solder pads with a desolder gun:
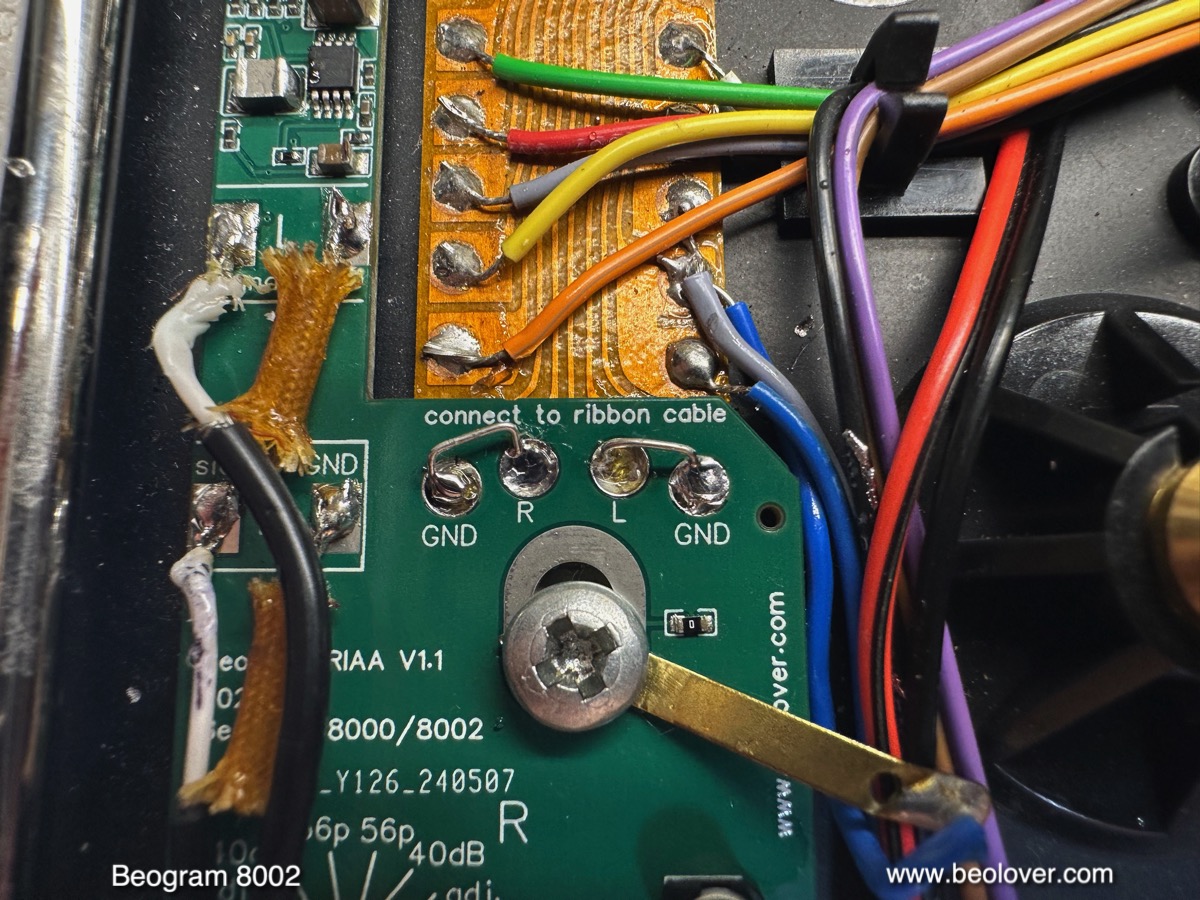
After removal of the mounting screw at the end of the ribbon cable assembly, I bolted the RIAA board in using the same screw and positioned it to overlap with the four solder pads of the output cables. Then I put a small amount of solder into each of the 'connection vias' of the board to make the connections between the RIAA inputs and the ribbon cable terminals:
The next step was to connect the L and R wires to the respective output terminals of the RIAA board:
I replaced the original woven insulation of the shield braids with modern shrink tubing (black) for a cleaner look.
The final part of the installation was connecting the RIAA board to its power supply.
Unfortunately, there is no power connected at the end of the ribbon cable, i.e. a separate wire needs to be installed to the 15V regulator. I connected a wire to the "15V" solder pad of the RIAA:
Note that the 15V label corresponds to the minimum voltage the RIAA needs for proper functioning. The maximum voltage allowed is 36V for this design. The next step is routing the wire to the voltage regulator PCB next to the front rod of the carriage. I recommend routing the wire along with the other wires beneath the subplatter. The critical routing points are labeled yellow in the photo below:

By feeding the wire under the plastic clips that hold the other wiring in place, it reliably avoids chafing with the sub platter. This shows the first of the clips (counted from the RIAA board):
And this the second when the wire emerges from underneath the subplatter:
This is how these two spots look with the subplatter installed:
The wire terminates at the input terminal of the TIP32 (0TR1) voltage regulator of the 15V rail. This terminal connects directly to the rectifier and main capacitor of the 15V rail and usually carries about 23V. I soldered the wire to the terminal, and this concluded the installation of the RIAA board!:
And then it was time to enjoy this redesigned RIAA pre-amp! I plugged the Beogram into the tape input of my amplifier and put on one of my favorite records, "Very Tall" by the Oscar Peterson Trio with Milt Jackson. This record was released in 1962 on Verve Records. I appear to have a re-issue from 1982 (UMV 2026).
Beolovely! This Beogram is now ready to be used with pretty much any modern amplifier or 'device' that still has a wired line-in!






Saturday, August 3, 2024

New Internal RIAA Pre-Amplifier for Beogram 8000/8002 - Installation and Characterization

I was recently offered a nice looking Beogram 8002 from a gentleman in Oregon. After I received the unit I decided to restore it and while I had it opened up on the bench, I thought it would be a good moment for adapting the Beolover RIAA pre-amplifier design for this type Beogram. The 8000 series is popular among B&O collectors due to its unique linear induction platter motor, which drives the platter directly without any mechanical contact.

This shows the new Beolover RIAA pre-amplifier design:

I had to dramatically reduce the circuit dimensions due to the much less open interior space of the Beogram 8000 series. The design uses the exact same amplifier circuit I designed for my initial 400x pre-amplifiers, but the power supply is adapted to work with the 15V system of the Beogram 8000 series.
Implementation of this board requires opening up the Beogram. It is best to put it into 'service position', i.e. remove all significant components from the enclosure and set everything up on the bench:
This enables easy access to the ribbon cable that connects the output wiring to carriage and tonearm. This shows the end of the ribbon cable in its original state. The two left and right output cables are soldered to terminals on the ribbon end:
After removal of the wiring, a pattern of 4 circular solder pads is revealed:
The Beolover 800x RIAA pre-amplifier is soldered directly to these pads. It also bolts in mechanically using the bolt that connects the Beogram wiring to chassis:
The power connection to the board unfortunately requires routing a wire from 0TR1 that makes the stabilized +15V supply. This shows 0TR1 next to one of the carriage rods
The orange wire that connects to the emitter of this pnp TIP32 transistor carries about 21.3V from the rectifier. This voltage is used to power the RIAA board. The thicker red wire that is soldered to the solder terminal of the orange wire in the picture above is routed to the RIAA board and soldered to its 15V (min) terminal (see picture above).

After this fairly straight-forward installation, I characterized the circuit. Since the amplifier section of the board is identical to the version for the Beogram 4002 and 4004 series, I will only discuss the noise characterization here, which is specific to the Beogram 8000 series. The amplification and RIAA de-emphasis data is identical to what I discussed earlier in the post about the original 400x design.

When considering internal RIAA pre-amplifier designs the amount of electromagnetic interference (EMI) and back EMF from the platter motor leaking into the amplified signal is the most important quality factor after the performance of the pre-amplifier itself.
Since motors are notorious for feeding back voltage ripple into the power rails of their supply, it is necessary to take special precautions when designing an internal pre-amplifier that shares its power supply with a motor. RIAA preamps have their maximum gain of around 60dB in the lower frequency range due to the fact that lower frequencies are encoded at smaller amplitudes in the record grooves.
60dB corresponds to a 1000x voltage amplification. Unfortunately, platter motors usually generate voltage variations in exactly this low frequency range, i.e. even the smallest motor related voltage ripple can become very audible in the audio output signal if the amplifier supply is not carefully separated from the main supply of the turntable. As an example, a small 1mV motor ripple in the amplifier supply voltage could result in a 1V output ripple at 60dB amplification! This would be about the same volume level like that produced by a loud section on a vinyl record.

Characterization of the noise performance of the Beolover internal RIAA pre-amplifier for Beogram 8000 and 8002:

I used a QuantAsylum QA400 audio analyzer for these measurements. The QA400 is a predecessor of the currently sold QA403. The QA400 is essentially a very sensitive analog to digital converter (ADC) that is matched with software that can show a Fast Fourier Transform (FFT) of the audio signal. The resulting 'FFT spectra' essentially show the amplitude of individual frequency components of an audio signal plotted on the frequency axis. A simple example would be the FFT of a perfect undistorted 1 kHz tone. The FFT spectrum of this signal would be a single peak at the 1kHz frequency.
When measuring noise spectra with such a device, one gets spectra that show all the different frequency components of the noise. Ideal 'white noise' would yield a spectrum that has the same amplitudes for all frequencies, i.e. one would get a horizontal line above the frequency axis.
Real life situations are usually more complex and this brings us to the graph below:

This graph contains FFT spectra measured at the output of the Beogram 8002 deck before and after installation of the RIAA pre-amp board.
All five spectra were measured with the arm down and the platter running. In other words in the situation one encounters when playing a record.

The green spectrum at the bottom was measured before installing the RIAA pre-amp, i.e. represents the situation found in an Beogram 8002 in its original factory condition. The signal from the cartridge goes directly into the DIN7 output plug without any electronic circuitry in-between. Therefore the noise seen in this spectrum is purely related to the Johnson noise coming from the cartridge coils and the wiring hooked up between the cartridge and the QA400 audio analyzer, plus any EMI from external sources. The peak at 60 Hz is related to the EMI coming from the power system around the house where I did these measurements. It is very difficult to get rid of this peak in practical terms since this type of EMI is omnipresent in the environment and so would require complete Faraday shielding of the measurement setup. Luckily in FFT spectra one can easily identify it and then ignore it as a measurement artifact.

It is more interesting to look at the other end of this spectrum, where we see a number of small peaks. These peaks seem unique to the Beogram 8000 series since I did not see them in the corresponding spectrum measured when I characterized the original Beogram 4002/4004 version of this amplifier design.
While it is difficult to determine the origin of this noise signal with 100% certainty, my hypothesis is that it is interference from the linear platter motor. This motor is much more exposed than the fully shielded DC platter motors of the earlier Beogram 400x series and so it seems likely that these peaks are caused by EMI from the drive system.
This EMI seems to couple into the output signal via the traces on the ribbon cable that connects the tonearm wiring to the terminals where the output wires are connected. This ribbon cable is a mechanically elegant solution enabling carriage motion while maintaining wire connections, but is not shielded at all. In comparison the preceding 400x series Beograms bring shielded wiring right up to the base of the tone arm before it becomes exposed. This may explain the more quiet spectrum I measured for the 400x.

This hypothesis is supported by the measurement results on the RIAA pre-amp shown above the green spectrum. The first spectrum I measured (brown) was measured with the RIAA board soldered in, but the inputs connected directly to GND with small wire bridges. This is shown here:

This measurement allowed characterizing the noise that is contributed by the amplifier itself, since the signal at the inputs is 0V (GND). This is a common approach for testing the noise background of amplifiers.
Let's have a look at the spectrum. It basically replicates the low frequency peaks already seen in the green spectrum, which are measurement artifacts, but it does not show any of the high-frequency peaks seen in the green spectrum. This means that these spectral components in the green spectrum really come from 'before' the RIAA amplifier, i.e. from the wiring between cartridge and amplifier input.
This is clearly supported by the next spectrum (red) that was measured after removing the GND jumpers. In this case the signal from the cartridge was directly fed into the amplifier, and the amplifier duly amplified the noise.
In fact, when connecting the Beogram output to my amplifier, I was able to hear a weak noise signal from the speakers when turning up the volume to maximum. Music at this level would certainly have alerted our neighbors...;-). I.e. for all practical purposes this is a very weak noise signal that needs a lot of amplification to be audible. But the FFT spectrum mercilessly shows it in a fairly dramatic way!

To further characterize the significance of this EMI noise I did two more measurements, this time using  'Ultimate Analogue Test LP' from Analogue Productions. This test LP allows doing FFT measurements under actual vinyl record playback conditions. The blue spectrum in the graph was measured while playing Track 6 on Side 2 of this record ("Silent groove for bearing rumble and table isolation"). This track is a simple smooth V-groove without any encoded audio signal, i.e. it mainly produces vinyl groove surface noise (and of course a few klicks and pops). This essentially gives us the noise floor of a well-manufactured record. We see here that the blue spectrum has a considerably higher noise level than the red spectrum. The EMI noise only very weakly peaks through in this spectrum, i.e. it basically blends into the vinyl surface noise. I was not able to discern it anymore from the vinyl noise when listening to the track via my amplifier, even at very high volumes.
The final (black) spectrum in the graph was measured on Track 1 on Side 1 of the record, the "1kHz reference tone", which basically simulates actual listening conditions. This spectrum is dominated by a singular peak at 1 kHz, accompanied by its harmonics towards higher frequencies. These harmonics are mainly caused by distortions in the cartridge, which are typically around 1% (the amplifier itself has only about 0.012% harmonic distortions).
More interesting for this discussion is that the surrounding noise spectrum is even higher than the pure vinyl surface noise and in this spectrum the EMI noise is completely drowned out by noise coming from the 1 kHz track.

After this analysis it was time to enjoy this restored Beogram 8002 and just listen to some nice music. I selected one of my favorite records, "House Boat" by Volker Kriegel, which he recorded for the MPS (Music Produziert im Schwarzwald) label in 1978 (MPS 15.535). In my opinion one for the best Kraut Jazz records of all times. Maybe one of the best jazz records overall (I know...beauty is in the eye of the beholder...;-).
Anyway, a perfect record for a Beogram that originated from the early 1980s! Of course this record was cleaned ultrasonically before play with a CleanerVinyl ProXL setup to bring out its full analog vintage glory!
Here is an impression of the setup!...I always like playing the 800x turntables in their service position. Almost looks like one of those Very Expensive Modern Designs!...;-)

This sounded all very well! A pretty happy result. This Beogram can now smoothly be integrated with more modern B&O systems that do not have a phono input anymore.
This Beogram will need to remain in service position a little longer. I am working on one more upgrade, which I am hoping to feature soon in another post.


Friday, July 1, 2022

Beogram 4004 Type 5526: Control Signal and Sensor Signal Measurements

In this post I will show some bench measurements of this Beogram 4004.
It has been performing great and it is time to look at what is going on electronically (since I completed all of the electrical work).

I used an oscilloscope to monitor four key control signals.  Then I measured the Run-Off Stop circuit signal from the position sensor.  Last, I measured what the record detection sensor circuit looks like as measured at transistor 1TR3.  

Here is the relative part of the schematic that shows the four control test points I measured.
I wanted to capture those test points for various key Beogram control events (i.e. Start, Stop, Cueing, etc.).


Highlighted on the diagram are four control signal test points (ON, OFF, Cue Down and Cue Up).

Note: B&O changed the wording on the Beogram 4002/4004 control buttons so in some Types there are buttons: ON (<<) and OFF (>>) while on other Types the buttons say START (<<) and STOP (>>).

The diagram also shows 1D41 where I measured the Run-Off Stop signal.

Here are the test point wires connected for making the measurements.  It also shows the test point wires for the Record Detection circuit and the Run-Off Stop.


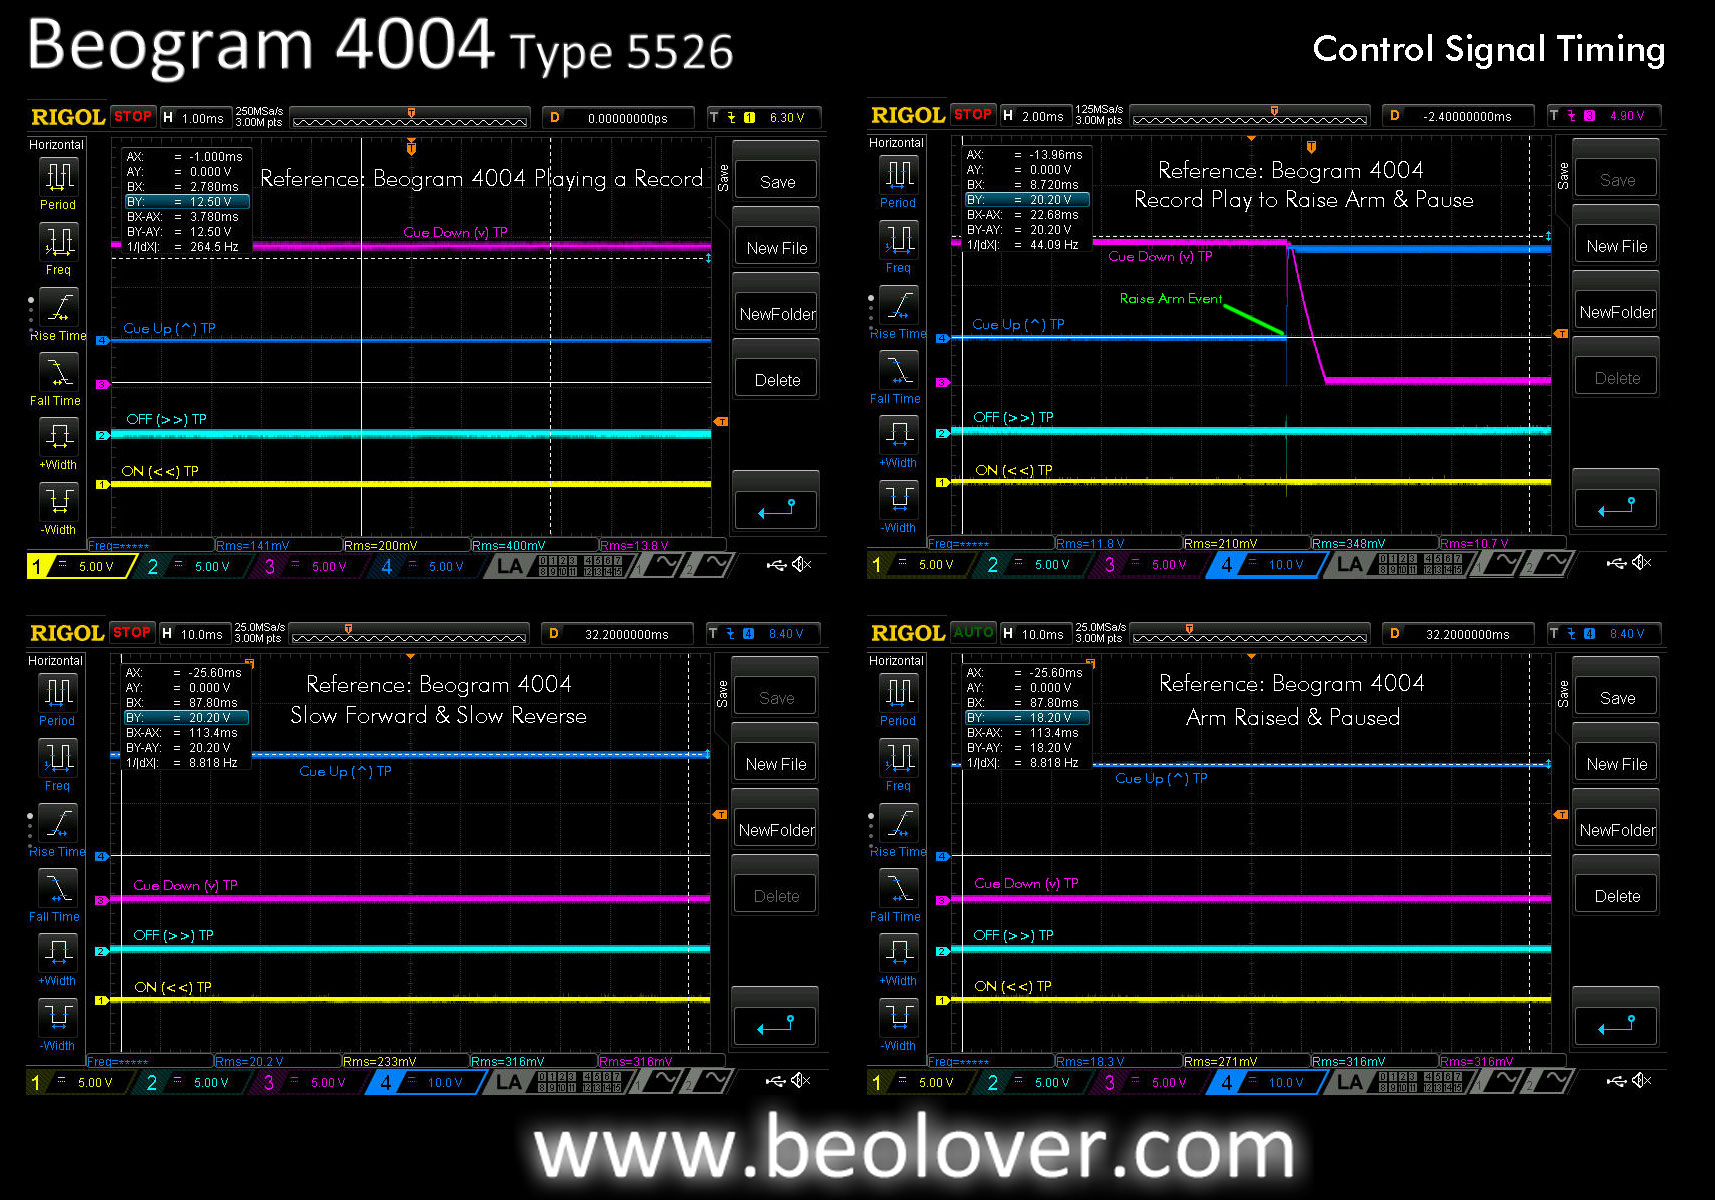
The following three pictures are oscilloscope screenshots for various Beogram 4004 events.

Viewing Tip: If the enlarged photo is too small to read the printed measurements, right-click the photo and select "Open link in new tab" or "Open link in new window".  The image in a stand-alone tab will allow you to zoom in for more detail.

In the first grouping I have a reference measurement of the four test points when the Beogram is turned off.  Next to it are the signal measurements when the START button is pressed.
Below those two measurements are the signals when the Beogram finds the set down point and lowers to play a record.  Last, are the signals when the arm is lowered and playing a record.


The next grouping continues with another picture of the control signals during record play.
That is followed by a cue up (arm raised), pause event.
The third picture shows the signals when the Beogram is operated in Slow Forward and Slow Reverse.
The final picture shows the signals when the Beogram is just paused over a record.

Note that the Cue Up signal is only active when the Beogram is in play mode and is either paused or scanning slowly (forward or reverse).  The Cue Up signal is off when the Beogram is scanning fast (forward or reverse) or cued down.


The final grouping shows the signals during the event where the Beogram is operated in Fast Forward mode until it reaches the ES (End Stop) switch and reverses to Fast Reverse.
The picture next to that is the event where the Beogram is in Fast Reverse mode and reaches the SO (Shut Off) switch.
The bottom left picture shows the event where the Beogram is cued down (playing a record) and the STOP button is pressed.  
The bottom right picture changes out the ON (<<) TP with the Run-Off Stop TP and shows the Run-Off Stop signal in relation to the OFF (>>) TP.


This photo shows the Beogram 4004 position sensor and scale that generate the Run-Off Stop signal.


This final photo of this post is another oscilloscope screenshot of the Record Detection circuit.
The test point is at the 1TR3 transistor collector and shows the signal generated by the Fixed Arm sensor over an empty platter (after processing through transistor 1TR3).


That is what I want to see.  A very healthy signal showing an empty platter.  The low part of the signal drops all the way down to zero volts and the peak is around six volts.  Very nice. 

This Beogram 4004 is performing great and in the next post I plan to wrap up the service manual adjustments.

Wednesday, February 28, 2018

Beomaster 8000: Evaluating the Audio Performance

This Beomaster 8000 receiver has been playing music in my lab since I finished the recap and output amplifier adjustments. The sound is great as it always is with these receivers but human ears are subjective and we like to measure some key values with test equipment to have some actual numbers to compare with. For amplifiers we typically use a sine wave test input voltage and measure the output of a preamplifier or power amplifier to check the total harmonic distortion (THD) and sound to noise ratio (SNR).

For this Beomaster I set my test up to check some input voltages at some key frequencies and measure the output amplifier at the speaker outputs.

For the speaker output measurement I connected a pair of fixed 8Ω loads. Obviously the fixed resistive load isn't exactly like a real speaker system load but by using the fixed 8Ω load I should always have a good measurement value I can compare other amplifier results to.

Here are my dummy speaker loads. They are power resistors connected to a very large heat sink. When I drive the output amplifier up to its rated power output (100 Watts into and 8Ω load in the case of the Beomaster 8000) the load resistors will get quite warm.


I am going to measure the THD and SNR values with my QuantAsylum QA400 audio analyzer. Since the high speaker output voltages would damage the analyzer inputs I use a low noise differential probe to lower the signal to a level the analyzer will accept.

This picture shows the Beomaster 8000 left and right speaker outputs connect to the dummy 8Ω resistor loads where the differential probe is attached and the signal connected to the QA400 inputs.


For the test inputs I want to use a constant sine wave of 1Vrms at frequencies from 20Hz to 20KHz.
I use the signal generator of an HP8903 audio analyzer for the test input signal and check it with an oscilloscope as I route the test signal to the Beomaster 8000 Tape 1 (TP1) inputs.


I started with a 1KHz signal as that is a common frequency for a lot of the audio specs manufacturers publish. It is also in the middle of the frequency range on the log scale.

It should be noted that before starting the measurements I adjusted the Beomaster 8000 source input levels to set the left and right channel levels as close as possible to each other. Those input level adjustments are on the left side of the Beomaster cabinet.


Using the Beomaster volume control I increased the volume of TP1 while monitoring the output with the QA400 analyzer and the Beomaster clipping lamp.

With the 1Vrms input signal I got to the clipping point when the Beomaster reached 5.9 on the volume indicator. I backed off that volume to 5.8 and measured between 28Vrms and 29Vrms at the speaker load. That corresponds to about 100 Watts of output.

Here is what the QA400 analyzer measured.


The THD levels are very good. Both channels are comfortably less that 0.05%.
For the SNR value I notice that B&O specifies their Beomaster 8000 SNR value as "A Weighted" and should be >77dB for the Tape input. The frequency and output level isn't specified but I am doing my measurements at the maximum rated output level so I turned the A-Weighting on in the QA400 and got these measurements (at 1KHz).


The SNR values are below the expected 77dB for the Beomaster and the left channel THD went up some. It is still below 0.05% but I thought it was odd that it moved and the right channel didn't move much.

Checking other frequencies (400Hz, 10KHz and 15KHz) resulted in the left channel being within THD specs but not as good as the right channel.

These results are not bad but I would like to see closer values for the left and right channels during this testing as I am using the same input signal and the load resistors are identical. A common culprit in the amplifier performance for the Beomaster 8000 are the OpAmps used in the preamplifier board and tone control board. Those are the LF353N, TL072CP and uAF772TC OpAmps. The audio source signals go through these OpAmps so their performance directly affects the Beomaster amplifier performance.

In the case of changing out the OpAmps it is best to change them all (left and right channel). That way all of the signal paths are using new OpAmps that should be pretty much identical.

When replacing the OpAmps I am also going to install 8-pin sockets for the integrated circuits. Here is the preamplifier board with its original OpAmps (seven total)

 Here are the sockets for the new OpAmps.

Here are the new TI LF353N OpAmps installed.


Next is the Tone Control & Filter board. This Beomaster 8000 unit has five OpAmps to be replaced on this board. Note that some Beomaster 8000 units have a six.  This picture shows the five OpAmps replaced.


The OpAmp identified as 4IC6 is for the Beomaster volume control circuit. Whenever that OpAmp is changed it is very likely that the volume control circuit offset adjustment will be necessary to be performed.


Here is the circuit schematic.


The section outlined in red shows the left channel trimmer for the volume control offset adjustment.
You immediately know if the adjustment is necessary because you will hear audible clicks in the related channel's speaker as you turn the volume up or down. Adjusting out the offset removes those click sounds.


Now that the OpAmps are changed out and the volume control offset is readjusted I remeasured the amplifier outputs.

The THD and SNR (A-Weighted) both improved plus the left and right channels are close to the same.


I have done a couple Beomaster 8000 restorations where I replaced the OpAmps with a higher performance TI OPA2134A (SoundPlus) device. However, in measuring the performance with that OpAmp versus a new TI LF343N OpAmp I could not see any measurable differences with the analyzer. Since the OPA2134A costs four times that of a new LF343N I recommend using the latter.

As a final check I used the QA400 impulse stimulus and measurement system to make a frequency response measurement of the Beomaster. This test also uses the same test setup. The difference is the Tape 1 stimulus is from the QA400. I have to admit I am not 100% comfortable with this test yet but it is worth looking at and recording for future reference with other Beomaster unts. The results look pretty good from 20Hz to 15KHz. However, I was hoping the 20KHz level would be a little higher. As it is it measures around -0.8 dB instead of the -0.5dB.


I will finish closing the Beomaster 8000 cabinet back up then do some actual audio component tests using the Beogram 8000 and a Beocord 9000. That will make sure all of the playback and recording features work as well as the Beomaster 8000 remote control.