Featured Post

Beolover SyncDrive: DC Platter Motor Replacement for Beogram 4002 and 4004 (Type 551x and 552x)

Late Beogram 4002 and the 4004 (Types 551x and 552x), which have DC platter motors instead of the earlier synchronous AC motors usually suff...

Showing posts with label measurement. Show all posts

Monday, May 27, 2024

Another Surprise Addition To The Workshop Beogram 4004

 Back in 2021 I restored my own personal Beogram 4004 turntable, dubbed the "Workshop Beogram 4004".  That same year I added the Beolover Remote Commander to it and have happily been playing a lot of records with it.

This year I have another surprise addition to my Beogram 4004...a Beolover SyncDrive Platter Motor.

Ever since reading the Beolover Blog announcing the Sync Drive I have been wanting to try it out.

As I mentioned, my Beogram 4004 was already restored and I use it regularly.
The DC platter motor had been restored by Beolover back in 2021 and works great.

However, I love the idea of a self calibrating platter motor that is even more accurate and was ready to try it out in person.

First, I remeasured the original DC platter motor using the Belovover RPM Tool v2.
I wanted to have current values to compare the original platter motor with the SyncDrive.


This screenshot shows the measurements from the Beolover RPM Tool v2 being recorded on a PC.


I ran the measurements for twenty hours.  Of course that is way longer than a platter motor would ever be run in normal use but it has been the length of time we usually collect RPM measurements on the Beolover Blog for comparison.

After saving off the measurement data for the original platter motor (at 33.33 RPM) I switched out the motor with the new Belover SyncDrive.

The changing of the motor is incredibly easy.


Here is the Beolover SyncDrive as received from Beolover.


Here is the connection point to the Beogram 4004 main board.


Here is the SyncDrive installed.


...and turned on by starting the platter turning and pressing one of the SyncDrive control buttons.


The SyncDrive came on showing me that my current settings have a 33.33 RPM value that is a little too fast.  Not surprising since I hadn't run a calibration with the SyncDrive yet.

Here is the Beogram 4004 platter speed measurement with the SyncDrive installed and after it calibrated itself for 33.33 RPM.


How great is that?  So easy.

My favorite features of the SyncDrive are its control buttons.
I love being able to run automatic, self calibration for 33.33 and 45 RPM.
I also really like locking out the original Beogram control panel speed adjustment controls.

Now for the measurement comparison.
Using the Beolover RPM Tool v2, I also measured the 33.33 RPM of the Beogram 4004 platter using SyncDrive.  Again, I ran the measurement for twenty hours.


Looking at the measurement results you can see that both platter motors produce a consistent and controlled platter speed for twenty straight hours.

That is what I expected.  After all, my original DC platter motor was restored by Beolover back in 2021 and should easily last another forty years.

However, you can also see how much tighter the RPM measurement is with the SyncDrive controlling the speed.

Also note that the mean for the original platter motor shows that it had drifted a bit slower than my original setting in 2021.  It measured a mean value of 33.24 RPM.  
The 33 RPM trimmer on the Beogram 4004 main board could be used to readjust that along with a good measurement tool like the Beolover RPM Tool v2.

With the SyncDrive motor that type of readjustment is no longer necessary.  You simply press the Auto Cal. button and two minutes later the platter speed is calibrated and locked in.

With either a Beolover restored DC platter motor or a Beolover SyncDrive, a Beogram 4002/4004 owner can get a beautifully functioning turntable.  I just prefer (and appreciate) the technical achievement and performance of the SyncDrive.

Now back to listening to records.

Wednesday, March 20, 2024

Beolover SyncDrive: DC Platter Motor Replacement for Beogram 4002 and 4004 (Type 551x and 552x)

Late Beogram 4002 and the 4004 (Types 551x and 552x), which have DC platter motors instead of the earlier synchronous AC motors usually suffer from dry motor bearings and/or bad spark snubbers. This often causes very noticeable RPM variations that ruin the listening experience. These motors can be restored by oil-infusing under vacuum, but even when restored, they do not measure up to the original AC platter motors or the later linear drives in the Beogram 8000 and 8002. Often there is significant RPM drift due to temperature variations and other environmental influences, and the analog feedback-based RPM control circuit causes fairly strong wow and flutter compared to the AC-motor Types and the 8000 series.

Once I realized the relative inferiority of the DC drive a few years ago (and also being slightly annoyed by restoring one DC platter motor after another..;-), I started working on an adequate replacement for these motors. I desired an upgrade for DC Type Beograms that would make them as good as the other models. This took me on a long and pretty interesting journey exploring different motor types and control approaches.

I finally settled on a brushless three-phase motor. The motor in the final design is custom manufactured for best performance and it is synchronously driven. The control system is able to measure the actual RPM of the platter, which enabled an auto-calibration feature that allows precise RPM adjustment.

I made a (rather long...sorry!...;-) video that explains the in and outs of the SyncDrive, demonstrates installation, use and gives a discussion of its performance relative to the other Beograms of the day. Enjoy:


The SyncDrive is available via the Beolover Store. Send an email to beolover@gmail.com if you are interested/have questions.

If you rather read than watch: Here is a short summary of the most important aspects:

The SyncDrive is an easy plug-and-play installation without the need for soldering (see video below). This is how the SyncDrive looks installed in lieu of the original motor:
The board bolts directly to the mounting posts of the original DC motor, and the electrical connections are made by a single wire harness that connects to the main board:

This picture indicates the essential features of the SyncDrive:
The speed sensor measures the platter speed from below, using the platter ribs in the same way the BeoloverRPM device uses them from above.
The user interface is activated by pressing any of the four buttons while the platter rotates. Once pressed, the indicator LEDs come alive and the interface is ready to interact. The buttons allow automatic calibration of the RPM and manual adjustment (33 and 45 are independently adjusted/calibrated depending on the actually selected RPM of the Beogram). Furthermore, the influence of the RPM panel above the keypad can be deactivated if desired. This can be useful if there are issues with the potentiometers in this panel, or if accidental RPM change is to be prevented.

I characterized the performance of the SyncDrive using the BeoloverRPM device, which allows precise RPM measurements and log them over time. 
This shows a direct wow and flutter comparison between a restored DC-motor and the SyncDrive:
The measurement covers about 60 turns of the platter. The 'noise' in these spectra is caused by small variations of the spacing between the platter ribs. Since the BeoloverRPM device measures the time between the passing of ribs under its sensor, slight variations of the spacing introduce a measurement artifact. The two shown measurements were performed in the same Beogram with the same platter, i.e. have the exact same platter pattern. This allows a direct comparison. The red curve was measured with the SyncDrive installed, while the blue curve was measured with a restored original DC motor. The 'beating' pattern of the blue curve is an indication of the analog control system acting to keep the RPM constant. In essence, the RPM of the original motor 'meanders' around the 33.33 set point in an attempt to stay close. All feedback based control systems operate that way: The actual RPM is compared with the setpoint, and when the RPM is too low, the motor speeds up until it is measured too high, then the process reverses. This causes a wavy trajectory of the actual RPM around the set RPM. The art of feedback systems is basically to keep such variations at a minimum. The analog control system of the 4002 does a pretty decent job, but it is no match for the precision of synchronous motors, which do not rely on feedback, but rather on a very stable oscillator that determines the RPM top-down, and the motor simply 'obeys'. Precise oscillations can be generated with high accuracy, which makes such motors superior as platter motors.

This can be clearly seen when comparing the performance of the earlier AC platter motors found in Beogram 4002 550x Types and the original 4000. This graph shows the above two curves in comparison with a curve measured on a restored Beogram 4000, as well as the later 8000 and 8002 types:


The pink curve was measured on the 4000. It is clear that the performance is much better than the DC motor, which is a direct result of the synchronous operation of the can stack AC motor of the 4000, which is driven by an analog Wien precision oscillator. The slight waviness of the curve is most likely the result of the elastic coupling between the motor pulley and the platter causing a weak 'jo-jo effect'.
It is interesting to compare the performance of the belt drives with the later linear motors of the Beogram 8000 and 8002. Sonavor kindly contributed the green curves when I sent him the redesigned BeoloverRPM for testing. The overall RPM stability seems very similar to the 4000 and the SyncDrive. This is interesting since the linear drive in the 800x is a feedback based system. Here we see that feedback does not need to be bad if it is well designed. The linear drive benefits from the absence of a belt, which takes the elastic coupling out of the equation. A digital control system coupled with high-resolution feedback from an ~80 slots tacho disk seems to be sufficient for a fairly precise control that is much better than what was achieved with the analog control of DC motors. It is interesting to compare the two green curves: The much smoother 'platter pattern' of the 8002 is a result of its different platter design: The earlier 8000 still used a 4002 style platter, and consequently its platter pattern is similar to the measurements on the 400x. The (likely) etched platter of the 8002 seems to have more smoothly varying spacings between the platter ribs. I do not know how they really made these platters, but the smooth variations suggest a projection aberration during pattern generation for the etching process.

It is satisfying to see that the SyncDrive is matching up fairly well with the early 4000 and the later 800x.
When it comes to long-term stability the SyncDrive is actually better than the early 4000:

While the 4000 has a much better wow and flutter than the DC motor 4002, it has similarly strong longterm RPM drift. This is not a surprise, since its Wien oscillator is analog, and therefore also more easily affected by temperature variations. The SyncDrive compares favorably with a much smaller drift, courtesy of its digital control system. Unfortunately, we were not able to perform such measurements on Beogram 8000 and 8002s (yet!...;-). They shut down after 30 min if they recognize that no record is being played. I suspect that their RPM stability is also pretty good due to their digital control system.

In summary, I think the SyncDrive turned out to be a nice upgrade for any DC-motor Beogram, bringing them to AC-motor Beogram level (and likely even 8000 and 8002 level in terms of RPM stability).


Thursday, January 11, 2024

Redesign of the BeoloverRPM Device: Precisely Measure and Log the Platter RPM

I recently decided to redesign my BeoloverRPM device, which I started developing in 2015 for the detection of intermittent RPM variations mainly of DC platter motors. I thought after ~8 years it could use a little update in terms of ergonomics and performance. The original device was based on an Atmega 328P processor (aka 'Arduino') and this limited the performance a bit. I recently got into using the much more advanced ESP32 platform. This enabled a few new tricks due to the much higher speed.

The new BeoloverRPM can be placed on the aluminum panels for a quick and convenient RPM check

but it can also be configured for frame mounting when working on a Beogram:
This was achieved by a design where the frame adapters can be removed from the main device:
The BeoloverRPM comes with two frame adapters that have different spacing between the 'legs' that straddle the enclosure wall. B&O used slightly different enclosure designs with varying wall thickness.

Another significant update is that the BeoloverRPM now has two data acquisition modes:
The modes can be selected via buttons on the device. The 'slow' mode performs similar to the previous designs. It shows the RPM and min/max values on the display, and sends a RPM snapshot to the serial port every 10s (faster if the RPM changes quickly).
The 'fast' mode is new: It graphs all datapoints as they come in whenever a rib passes under the sensor. The display shows a rolling snapshot of the last 64 datapoints. The data is also sent out via the serial port. Here is an example measured on a Beogram 4004:
The main graph shows the data output from about 60 platter rotations. The graph shows a repeating pattern modulated by a sinusoidal envelope. Closer inspection yielded that the pattern repeats every 24 points, i.e. everytime the platter makes a full turn (there are 24 ribs on the platter). This can be explained by minute changes of the rib spacing (it varies by about 0.1%).
The sinusoidal modulation is a result of the feedback based RPM control of the DC platter motors of the later Beogram 4002 and 4004. Feedback control always results in an oscillation of the actual value around the set point. And that is what we see here. The analog feedback mechanism used by the later Beograms is based on time constants defined by capacitors and resistors, and this results in sinusoidal RPM variations.
Fascinating stuff!...;-).

I made a short video about the new BeoloverRPM. Enjoy!


Monday, November 26, 2018

Beomaster 8000: Exchanging the Opamps in the Signal Path and Test

After updating the uProcessor board in the Beomaster 8000 that I am working on right now, it was decided to also update the opamps while the unit was in service position. We recently noticed that the opamps in the signal path of the Beomaster 8000 can degrade resulting in increased distortions (THD), i.e. it is a good idea to also replace the opamps when the boards are out for restoration. Here we go:

This shows the control panel PCB before the upgrade:
Most of the 8-pin ICs on this board are signal path opamps. This shows the board with new socketed LF535 opamps installed:


On to the preamp/input board. I forgot to take a picture of the original condition of the board. Here are a couple shots of the board after replacing the opamps with socketed LF353 units (except the phono input, which was replaced with a low noise LM833 type):
A detail photo of the phono pre-amp section:
After implanting the boards I characterized the performance of the unit with my QA400 audio analyzer. The bandwidth curve yielded the spec -1 dBV drop between 100 and 20,000Hz, and the total harmonic distortion (THD) values at volume 5.0 (just below clipping) were 0.008% on both channels, which is consistent with other Beomaster 8000s we measured. See here for a detailed discussion of such measurements. So far so good...the unit went on into our living room to see if the performance of this Beomaster 8000 is consistent in day-to-day operation.


Wednesday, April 18, 2018

Beomaster 8000: New Signal Path Opamps and Amplifier Performance Characterization with a QA400 Audio Analyzer

Inspired by Sonavor's recent effort to characterize the amplifier performance of a Beomaster 8000 after replacing all signal path opamps, my Australian customer asked that the same would be done to his 8000 before sending it back (after upgrading its circuit with a muting function for the FM section while the Phono input is selected to eliminate crosstalk).

And I am glad he asked. It turns out that it is a great idea to replace the opamps when performing a full restoration of the Beomaster 8000. My measurements yielded a 14 dBV improvement of the THD (Total Harmonic Distortion) performance on the left channel after implementing new opamps.

This shows the preamplifier and input selector board with the original opamps in place:
and after replacing them with new LF353 units (except the phono input, which was replaced with a low noise LM833 type):
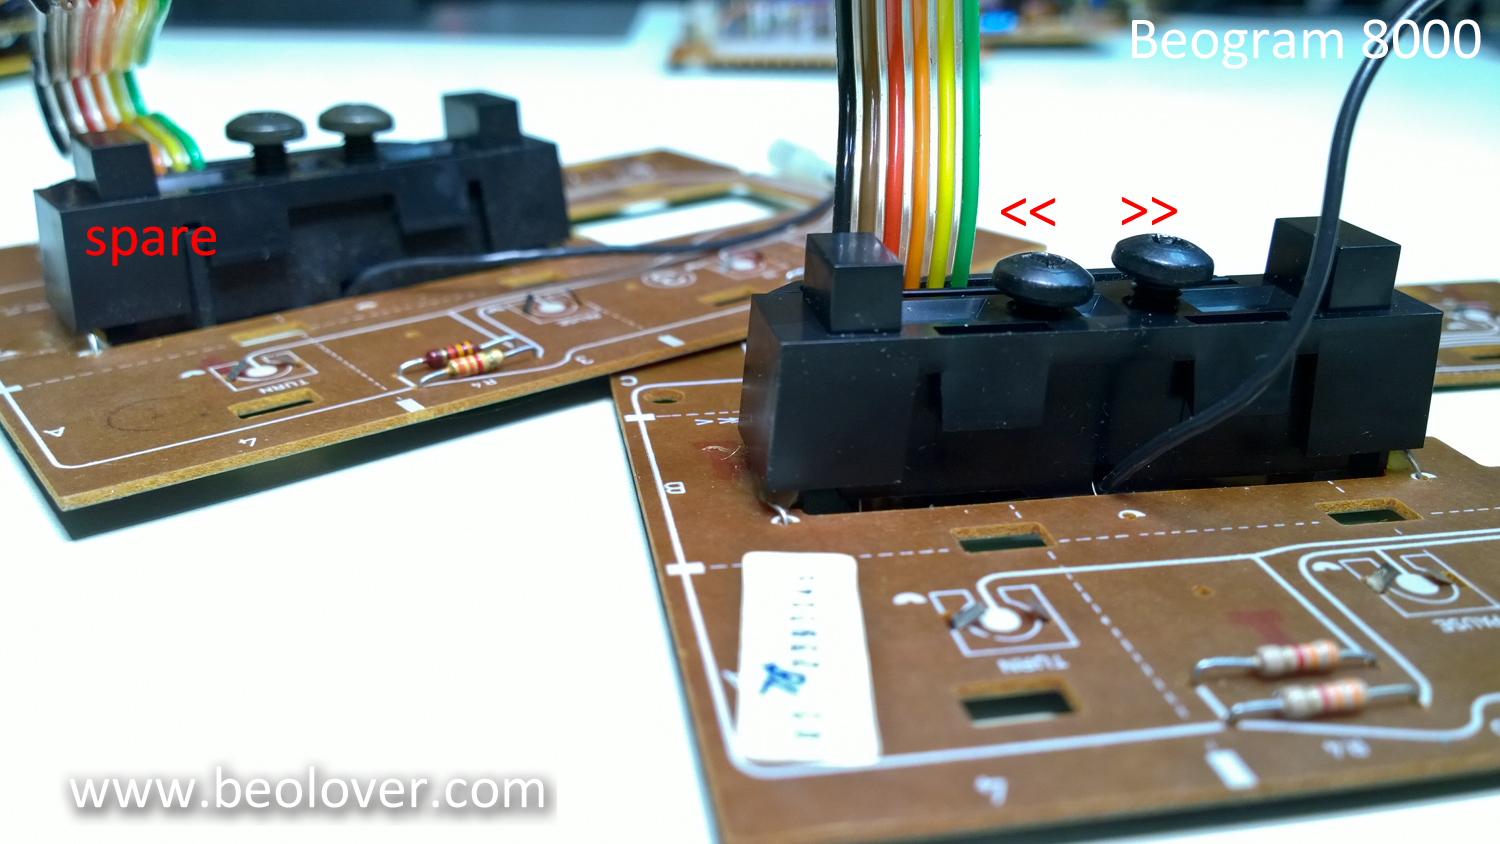
I used IC sockets to spare the opamps the stress of soldering. Probably not necessary, but then why not. I did the same for the control panel PCB. This shows it with new LF353s in place:
After putting the control panel back together I performed a series of measurements to see if the amplifier performance would measure up to the values given in the service manual. It turned out that such a comparison is difficult to make due to the inherently different measurement methodology used in the 80s and with the instrumentation that is available today. But I think the measurements below show that this 8000 is now in good shape.

Let the fun begin:
I use a Quant Asylum QA400 audio analyzer for such measurements. Essentially this device yields a Fast Fourier Transform (FFT) of the audio signal that is put into it, and it can perform some measurements (i.e. calculations on the FFT spectrum) based on that data. The measurements include power, total harmonic distortion, signal-to-noise, and frequency response. 
Let's have a look at the output spectrum measured with a 0 dBV 1 kHz signal at the Tape 1 input of the Beomaster:

The dBV values essentially give the amplitude ('level') of the signal relative to a standard 1Vrms signal V0. Since level=20*log(V/V0), a signal change of 20dBV corresponds to a 10x change of the amplitude. As an example, if the measured amplitude of the 1kHz signal at the output of the amplifier is 10 Vrms with an input signal of 1 Vrms from the waveform generator, then level=20*log(10/1)=20*1=20 dBV. If the output signal were 100 Vrms, the level gain would be 40 dBV and so on.

Looking at the spectrum above, you probably wondered why the 1 kHz peak is only at about -8 dBV, while the amplifier operated at a volume setting of 5.0, which is close to the maximum output amplitude it can muster. The reason is that the measurement was performed via a voltage divider that was connected as load at the output of the amplifier. The divider was built from two 4 Ohm 50W power resistors and a 0.1 Ohm 3W resistor in series. This shows the setup:
Since the Beomaster is able to produce 100W output power into an 8 Ohm load, the resistors need to be mounted on a heat sink. I used a RF amplifier can that I had laying around from another project. The Y-shaped red wires that are soldered to the small 0.1 Ohm resistor connect to the BNC jack on the right side of the RF can, which then is connected to the QA400 input. The resistor chain is connected on the left to the speaker jack of the Beomaster. This setup guarantees that the QA400 input never gets more than about 1 Vpp. But it also means that the output amplitude that the QA400 'sees' is only 1/81th of the actual amplitude that is applied across the 8.1 Ohms. 
Using the above level=20*log(V/V0) formula, we can calculate that the level difference due to the voltage divider is about -38dBV (20*log(1/81)=-38.17 dBV). This means that the 1 kHz peak in the above graph would be at ~-8+38dBV=~+30dBV. I could have shifted the peaks in the graph, but since all measurements that are performed are inherently differences between two levels, this shift really does not matter, i.e. in the following all levels are just as they came out of the QA400, i.e. -38dBV lower than the real signals.

So what do we see in the above spectra? Mainly the THD spectrum to the left of the main 1 kHz peak and some noise. We can see that the 1st harmonic at 2 kHz is about -84 dBV weaker than the main peak. According to the above calculation, this means that the amplitude of that distortion is about 10^4 (= 10,000) times weaker than the main signal. Well below what a human ear could notice. The -84 dBV value is close to the THD measurement result of the QA400, which came in at about -82 dBV (=0.008%). The measurement is a bit worse than the 84 dBV value determined from the graph since there are higher order THD peaks that add to the total distortion. This was the only measurement result that changed before and after replacing the opamps in the signal path. My initial measurements of the left channel yielded a measly -68 dBV THD value, and after the opamp exchange this was improved to -82 dBV. So I think it is a great idea to replace all opamps when the boards are upgraded with new capacitors, just to be on the safe side.

So how does this value compare to the THD value from the Beomaster 8000 service manual? The value stated there is "< 0.05%". So we could be happy and say: "Wow this 8000 is almost 10x better than the value in the manual!". Not so fast, I would think, since the manual states that the measurements were performed according to the "IHF A-202" standard. At this point I do not know what this means, i.e. we need to postpone this comparison with the stated values. But I think we can confidently say that this Beomaster is performing reasonably well and is probably within the original specifications.

Another interesting measurement to perform on an amplifier is its signal to noise (SNR) ratio. This essentially gives us a number that qualifies how much stronger the signal is relative to the noise ("hiss") of the amplifier. This measurement is a bit more difficult to do and understand since we are comparing a defined signal peak amplitude (or power) with a diffuse noise background that is composed of a continuum of frequencies spanning the entire audible range and beyond.

I played a bit with the QA400 settings and it turned out that the SNR measurement is strongly dependent on the number of samples used for the FFT transformation of the input signal. I was able to "change" the SNR value from 65 dBV to 88 dBV simply by changing the FFT resolution from 8196 samples to 65535 samples. This means that depending on the setting the SNR value changed by a factor of 10, one full magnitude. So what is happening? A bit of reading up on the internet and a semi-cryptic response from the Quant Asylum tech support suggested that at lower FFT resolutions the main 1 kHz peak spreads out over several 'frequency bins', thereby lifting the spectral power outside the 1 kHz line, which is misunderstood by the FFT algorithm as part of the noise. This means that at higher FFT resolutions this 'frequency spill out' becomes less pronounced. So we can assume that the higher value is closer to the true value, even though the true value may be even better. Unfortunately the QA400 can only go to 65535 samples, i.e. we would need to find better equipment for an answer. 
Wondering about this topic, I performed an experiment that would allow me circumventing the FFT based calculation of the SNR. I measured the signal power of the spectrum at various FFT resolutions and it turned out that the PWR value is not significantly dependent on the resolution. This makes sense since PWR measures the power of the entire spectrum, i.e. integrates over the entire frequency range. So resolution is of limited importance, as long as the signal peak is still 'caught' in one of the sampled frequency bins.
This realization enables a basic SNR measurement: Measure the PWR value with the signal present at the amplifier input and then ground the input and measure again. Subtract the two values and the SNR is obtained.
My measurements yielded on both channels -8 dBV with 1 kHz signal (at Volume setting 5.0) and -98 dBV with the input grounded (also at Volume 5.0). The difference is 90 dBV, a bit better than the best 88 dBV value measured via FFT analysis. This compares to a ">77 dB" stated in the service manual. Again, we do not really know at this point how the 77 dB value was measured, but I think we are on the safe side and can conclude that this Beomaster 8000 is operating on spec.

Another interesting measurement is the frequency response ("FR"). The QA400 does this measurement by sending a square pulse into the input of the amplifier and then measuring the response at the output. Since a square pulse contains all wavelengths, the FFT of the response yields a true spectrum of the amplifier FR. I verified this by manually measuring the transmission for a few frequencies and the FR curves were exactly matched, i.e. I think we can believe this measurement as it comes out of the QA400. This shows the FR spectrum measured on both channels:
I cut the spectrum off at 1 kHz since there was some 60 Hz noise, and the FR drop at 20 kHz seems typically referenced to 1 kHz. So what we see from the graph is that there is a 1 dBV drop from 1 kHz to 20 kHz. The manual prescribes 0.5 dBV, but of course, again, we do not know how this was measured etc...A difference of 0.5 dBV corresponds to a signal ratio of 10^(0.5/20)=1.06, i.e. the signal at 20 kHz is 6% smaller than it should be. Not very dramatic, and most likely this discrepancy is a result of the different measurement methodologies that were applied in the 80s.

Since everything was hooked up, I decided to measure the FRs for the various filters the 8000 has. This shows the spectra:
The spectra show the FR for filter 1, 2 and both active, for bass and treble sliders set to minimum and maximum, and the flat (filter button "off") response in direct comparison. We can see nicely that the treble and bass sliders allow a ~±10 dBV change of the higher and lower frequency ranges, and that the filters cut off around 7 kHz and 10 kHz at  as prescribed in the manual.

So in summary, I think we can say that this Beomaster is in excellent condition and that everything works as it should.


Friday, July 28, 2017

Beogram 4004 Type 5526: Record Detector Testing and Adjustments

This Beogram turntable has a new LED lamp source for the record detector circuit that is in the fixed arm. Part of that installation involved switching out a fixed 1MOhm resistor (1R26) with a 2MOhm trimmer resistor to allow better tuning of that detector circuit voltage. With the turntable parts re-installed I started the procedure of making an initial setting of the new 1R26 trimmer so the collector of 1TR3 is at 4 VDC when the fixed arm lamp is on.

I made that adjustment then moved the 1R26 trimmer resistor to the component side of the board where it belongs (so it is out of the way of the platter).


A quick test of the Beogram Start, without a record on the platter, passed with the sensor circuit correctly recognizing there was no record on the platter.

To complete this test however it is always a good idea to actually see the signal on an oscilloscope. I connected a probe wire to the 1TR3 collector and then to my scope. When I ran the fixed arm and tonearm over the platter I paused it so I could measure what the detector circuit is seeing.


I was surprised and disappointed to see that the peak to peak voltage of the signal was not from 0 V to around 6 V as expected. It only drops to about 2 V and goes up to 4.72 V.

So while the Beogram appears to detect an empty platter as it should, the signal is not ideal and could lead to problems later on. A little bit less peak to peak voltage and this circuit will not detect an empty platter.

I wanted to know if the problem was in the new Beolover light source assembly or with the fixed arm light sensor. The easy thing to try first was to use a powerful LED flashlight to enhance the light on the platter. When I did that I could make the 1TR3 collector signal go to its full range. But look how much light it took for the sensor to register that. Something must be wrong with the sensor.


As a second part of the test I pulled out the fixed arm lamp and sensor assembly a ways so I could move the Beolover LED module and watch the effect on the 1TR3 collector voltage.


Moving the LED light source could not make the signal peak to peak range any better. It could make it worse though and confirmed my fear that a little less voltage would cause the platter detection to fail.

Next step then is to swap out the fixed arm sensor. I decided to swap out the entire assembly first with one of my spares (from another Beogram 4004 turntable).

Here is the removal of the current sensor assembly that has the Beolover LED light source.


Here is the replacement sensor assembly. It still has an original incandescent light source.


Just like that, the 1TR3 collector signal went right to what is expected. The peak to peak voltage is from 0 V to about 6 V.


That voltage is with a dimmer light source as the Beolover LED light source is brighter than the incandescent lamp. The original fixed arm platter sensor is the problem and will have to be replaced.

Saturday, June 24, 2017

Beogram 8000: Trouble-Shooting Test Phase 1

I made the choice to try switching the Beogram 8000 control panel board first in the trouble-shooting of the intermittent record play interruption. This is the problem where occasionally the Beogram tonearm lifts to the Pause position while playing a record.

This is the easiest thing to check first and I kind of suspect the photo resistor circuit in the control panel on this Beogram anyway. When I made the service manual adjustments earlier in this restoration I noticed the adjustment for the adjustment screws were quite a bit different between the forward (<<) and reverse (>>). The adjustment screws control how much light shines on the photo resistor. The service manual says the normal voltage across those resistors (when forward and reverse are not engaged) is 620mV.

The following picture shows the control panel board removed. The position of the adjustment screws are where they needed to be to get the 620mV measurement. The difference in position of the two screws make me think one of the photo resistors is weaker than the other. Perhaps that is the reason for the fault I am trying to fix.


On the spare control panel board in the background you can see what I expect their positions to be like in relationship to each other.

One annoying thing about this adjustment is that B&O didn't provide good test points to check and adjust these controls without opening up the Beogram. It is easy to open just the control panel so if there were a nice test connector there I could check and make this adjustment after the Beogram is closed up.


The P5 connector pins 3, 4 and 6 are the nodes necessary to measure for this adjustment.
So I decided to add a test connector that I can access with just the control panel open. I also decided to do this test with one of my spare Beogram 8000 control panel boards.


I used a female connector for the end so I could leave the test connector attached. The picture above shows the test connector with the male test plug attached.

The test connector works great!  The Beogram 8000 is all closed up except for the control panel and I can easily use the test connector to make the adjustments.


I discovered that I will have to remove the test connector in this first attempt as the 24 gauge wires are too big and interfere with closing up the control panel all the way. If I want to have a "leave in" test connector I will have to go to a 30 gauge wire.

For now though it is time to return to the record play testing of this Beogram to see if the control panel was the problem. I am using the spare control panel board with the test connector and adjusted to the voltages specified by the service manual. On this spare board both adjustment screws are pretty symmetrical so that is a good sign that both photo-resistors are a pretty good match.

I am now on the last side of the second record play test. Only about eighteen more uninterrupted record plays (36 sides) to go for me to say the problem is fixed.