Featured Post

Beolover SyncDrive: DC Platter Motor Replacement for Beogram 4002 and 4004 (Type 551x and 552x)

Late Beogram 4002 and the 4004 (Types 551x and 552x), which have DC platter motors instead of the earlier synchronous AC motors usually suff...

Showing posts with label response. Show all posts

Sunday, November 12, 2017

Bang&Olufsen MMC20EN Vintage Cartridge Test

The Beogram 4004 parts that I recently restored came with a MMC20EN cartridge, which was to be tested.

There are two preceding posts about my (still evolving - Beolove never ends..;-) approach to cartridge testing. One outlines the test of the frequency range of a cartridge and the other discusses testing the 'trackability', i.e. how well can the cantilever track deflections in the groves of the record. This essentially tests the mechanical aspects of the cartridge, most notably the state of the cantilever suspension.

I currently use three test records:
1) The Analogue Audio Ultimate Test LP. This record has a pink noise track that is perfect for checking the frequency response of the cartridge in the audible range. Unfortunately, this track tops out at 20kHz, and so we need to use a different record to see if the cartridge can also reproduce higher frequencies.
2)  The Fisher Test & Performance Standard Quadradisc: This record has some CD-4 quadraphonic tracks which feature the 30 kHz carrier frequency that is needed to encode the two back channels. The test tracks have this carrier without any encoded sound, which is a great way to see if the cartridge can reproduce 30kHz.
3) The Clearaudio Trackability Test Record: This record is used to determine the condition of the cantilever suspension. It has 333 Hz tracks with different groove amplitudes from 50 um to 100 um.
This allows a measurement of how well the cantilever can deflect and at what deflections significant distortions occur that would negatively affect the sound quality.

Aside from these test records an audio analyzer with the capability to calculate a Fourier transform of the voltage signal coming from the cartridge is required. I use the QuantAsylum QA400 (now replaced by the QA401), which (aside from a somewhat lackluster user interface) is a very capable device that has a high sensitivity enabling plugging the turntable directly into its input without needing amplification. This allows analyzing the signal from the cartridge directly. I simply use a DIN to RCA adapter and connect the DIN5 of a Beogram directly to the analyzer input.

These are the results measured on the MMC20EN cartridge (at a tracking weight of 1.2g):

This is the 20 Hz to 20 kHz frequency response of the cartridge as measured with the pink noise track:


And this is the CD-4 carrier signal (sharp peak at 30 kHz):
The amplitude of this peak is supposed to be 1/10 (or -20 dBV) of the 0 VU 1 kHz signal, which is usually at about -47 to -50 dBV. The peak measured in the graph is at about -70 dBV, which is about where it should be. So far so good!

These are the results of the trackability test:

I used the 50, 60 and 70 um 333Hz test signals on the Trackability record. The 50 um track corresponds approximately to a 0VU signal, which is normally the maximum amplitude encountered on a standard record. The 60 um amplitude level approximately corresponds to a +6 dBV signal level. I measured these THD percentages:

50um left:     1.8%
50um right:   3.5%
60um left:     2.8%
60um right:   10%
70um left:      4.9%
70um right:    20%

Since THD levels up to 5% go unnoticed by most human listeners, this cartridge can still be used for records that adhere to standard amplitude levels, but at +6dB amplitudes distortions will be audible on the right channel...

Tuesday, April 4, 2017

Test of a Vintage Bang & Olufsen MMC4000 Cartridge

The Beogram 4002 (5513) that I recently restored came with a MMC4000 cartridge, which was to be tested. You can listen to this particular cartridge in the latest CleanerVinyl Before/After demo video that we made on the occasion of adding Freddie Hubbard's album "Polar AC" to our collection. You will hear that it sounds pretty good. Let's see if the measurement conforms...;-):

There are two preceding posts about my (still evolving - Beolove never ends..;-) approach to cartridge testing. One outlines the test of the frequency range of a cartridge and the other discusses testing the 'trackability', i.e. how well can the cantilever track deflections in the groves of the record. This essentially tests the mechanical aspects of the cartridge, most notably the state of the cantilever suspension.

I currently use three test records:
1) The Analogue Audio Ultimate Test LP. This record has a pink noise track that is perfect for checking the frequency response of the cartridge in the audible range. Unfortunately, this track tops out at 20kHz, and so we need to use a different record to see if the cartridge can also reproduce higher frequencies.
2)  The Fisher Test & Performance Standard Quadradisc: This record has some CD-4 quadraphonic tracks which feature the 30 kHz carrier frequency that is needed to encode the two back channels. The test tracks have this carrier without any encoded sound, which is a great way to see if the cartridge can reproduce 30kHz.
3) The Clearaudio Trackability Test Record: This record is used to determine the condition of the cantilever suspension. It has 333 Hz tracks with different groove amplitudes from 50 um to 100 um.
This allows a measurement of how well the cantilever can deflect and at what deflections significant distortions occur that would negatively affect the sound quality.

Aside from these test records an audio analyzer with the capability to calculate a Fourier transform of the voltage signal coming from the cartridge. I use the QuantAsylum QA400 (now replaced by the QA401), which (aside from a somewhat lackluster user interface) is a very capable device that has a high sensitivity enabling plugging the turntable directly into its input without needing amplification. This allows analyzing the signal from the cartridge directly. I simply use a DIN to RCA adapter and connect the DIN5 of a Beogram directly to the analyzer input.

These are the results on this particular MMC4000 cartridge (at a tracking weight of 1.2g):

This is the 20 Hz to 20 kHz frequency response of the cartridge as measured with the pink noise track:


And this is the CD-4 carrier signal (sharp peak at 30 kHz):


The amplitude of this peak is supposed to be 1/10 (or -20 dBV) of the 0 VU 1 kHz signal, which is usually at about -47 to -50 dBV. The peak measured in the graph is at about -65 dBV, which therefore is about where it should be. So far so good!

On to the trackability test:


This graph shows the total harmonic distortion of the 333Hz test signal. The 1kHz signal is a standard mono 0 VU signal, i.e. represents the highest amplitude normally encountered on a regular vinyl record. The other measurements are at 333 Hz, and the 60 um amplitude level approximately corresponds to a +6 dBV signal level. Since THD levels up to 5% go unnoticed by most human listeners, this cartridge can still be used for records that adhere to standard amplitude levels.

Sunday, April 2, 2017

Testing B&O MMC Cartridges with a QuantAsylum QA400 (Pt.2): Trackability

After making my first post about testing vintage MMC cartridges with a QA400 audio analyzer and some test records, I was advised by another B&O enthusiast that measuring the frequency range of cartridges is only half of the story (at best). The second important test is 'trackability', which tests how well a cartridge can reproduce signals at different amplitudes (='audible volume'), and at what volume it starts significantly distorting the signal. The crucial parameter in such measurements is the "Total Harmonic Distortion (THD)" that is superimposed on a principal test signal depending on the total deflection amplitude of the cantilever. The deflection amplitude becomes larger at higher audio volumes: The grooves 'wiggle' more strongly and so the cantilever has to make larger movements to convert the higher volume into electrical signals. This stresses the suspension of the cantilever more and the elasticity of the suspension becomes crucial for faithful conversion of the mechanical motion into the electrical signal. A hardened or otherwise damaged suspension will counteract the deflection and this causes distortion.

Yet another test record is needed for such trackability measurements: I used the "Trackability Test Record" from clearaudio for the measurements discussed here.

The test setup was a recently restored and properly adjusted Beogram 4002 (5513). The DIN5 cable of the turntable was directly fed into the RCA inputs of the QA400 analyzer using a DIN-to-RCA adapter, i.e. there was no RIAA amplifier in between. The sensitivity of the QA400 is vastly better than what is needed to measure the MMC signal, which is typically in the <10mV amplitude range.

The first experiment I did was with the MMC20CL cartridge that was also used in the initial post about the frequency range. This graph shows the spectra measured while playing the 60um and 80um trackability tracks of the test record:


These spectra show a Fourier transform of the signal that comes out of the cartridge. In essence the signal is split into its individual frequency components. The intensity of the peak is proportional to the amplitude of the particular component frequency. The left-most peak is the principal test frequency of 333 Hz. The peaks emerging to the right of this main peak are the harmonic distortion  (HD) peaks that are superimposed over non-harmonic noise. The blue spectra are from the 60um track and the red ones from the 80um track. One can see that the harmonic distortions become more pronounced at 80um compared to 60um. 

If you think that this (pretty nice sounding!) cartridge has a lot of distortion, even at 60 um, consider that the dBV scale is logarithmic. This means that a 6 dB amplitude difference on this scale represent a factor 2x in volume. So if you compare the principal peak with the first HD peak the scale indicates that there is about a difference of -30 dBV. This corresponds to a volume difference of 2^5=32, i.e. the first HD peak is 32x weaker than the main signal. This corresponds to a THD value of about 3%. The subsequent HD peaks are even weaker, adding only insignificantly to the THD value. Considering that the human ear can detect harmonic distortion at about 5% this measurement indicates that a 60um signal could still be enjoyed with this cartridge.

An interesting question is: What is a 60 um signal in the context of actual volumes occurring on normal records? An answer to this question is (like with most things analog) a bit complicated and does not have a 100% definite answer. An indication of the amplitude of a so called "0 VU" signal (i.e. the highest signal amplitude that is found on standard vinyl records) is given on the Trackability Test Record itself: Track 3 on side 1 is supposedly a 1kHz "standard maximum" mono signal. My measurements on this track yielded a 7 mV signal amplitude (~ -43 dBV) for the above MMC20CL cartridge. Note that "The Ultimate Analogue Test LP" that was used in the preceding post has a slightly different opinion about what a 0 VU signal constitutes: My earlier measurements with this MMC20CL cartridge on its 0 VU track yielded a signal of only 4 mV. So you see that this is not an exact science. And of course any avid vinyl listener will know that there is quite a bit of variance in how loud a particular vinyl is, i.e. different labels may always have used different 0 VU specs. 

Anyway, let's go with the 7 mV level as 0 VU signal for now:

In comparison, my measurements on the 333 Hz 60 um and 80 um tracks yielded signal amplitudes of 7.5 mV and 10 mV, respectively. Here we need to consider that the frequency spectrum is encoded on records with RIAA emphasis, which means that a 333 Hz signal that had the same volume than a 1 kHz signal when it was recorded should yield an approximately 50% smaller signal amplitude when played back without RIAA de-emphasis. Hence, since the amplitude measured on the 60 um track was about the same as the 1 kHz 0VU amplitude, we can hypothesize that the 60 um track corresponds approximately to a +6 dBV signal (i.e. a signal that is about 2x of the usual standard maximum signal found on records after RIAA deemphasis), so this track is a bit of a stress test already. In comparison, the 80 um track yielded a 10 mV (maybe a +9 dBV) signal.  I also measured the 'loudest' 100 um track, which yielded 13 mV, i.e. would corresponds to a +12 dBV signal.

The liner notes of the Trackability Test Record state that cartridges that can reproduce the 80 um track without too much distortion can be considered very good. So the bottom line for my vintage MMC20CL is that it is still o.k. and that it can reproduce 0VU levels without much noticeable distortion, but that it is probably not that fresh either. 

Of course we do not know how they measured these values back then, i.e. a direct comparison may not be appropriate, but we can glean from the report that "trackability 300Hz lateral +9 dB" came in with a 0.38% distortion when they did their measurements. If the above estimations are correct, this measurement might approximately compare to my measurement on the 80 um track. That we are at least in the right ball park with comparing these dBV levels is supported by the stated 1 kHz sensitivity number of 0.85mV per cm/s lateral deflection velocity. The Trackability Test Record gives a 8 cm/s velocity for its 1 kHz track, i.e. the output of the cartridge should be 6.8mV, which is close to the 7 mV value I saw in my measurements. 
I guess it is time to get a rebuilt MMC20CL cartridge from tonabnehmerservice.de and do this measurement again to see what a new suspension can do for the cantilever's ability to track....more Beoloving excitement in my future.

After measuring my MMC20CL, I also measured the MMC4000, MMC6000 and MMC20EN cartridges that were featured in my first post about the frequency range measurements. These are the values I measured for these three cartridges in comparison with the MMC20CL:

The x-axis starts out with the 1 kHz measurement on the left. The points to the right are the THD values measured on the Trackability Test Record 50 um to 100 um tracks. All cartridges show a significant THD uptick after the 60 um track. This is to be expected.

The single green trace at the top of the graph is from the MMC4000 cartridge, which apparently has a right channel that is in trouble. Even at 1 kHz and the 50 um track it has more than 25% THD. It definitely needs a rebuild. The other cartridges seem to be in a 'usable' condition since they are below 5% THD even on the 60 um track. It is remarkable that this cartridge did not show any misbehavior during the frequency range test. This is a clear indication that trackability is probably the more important measurement for determining if vintage cartridges are still performing adequately.

A remarkable feature is that for all cartridges the THD increases more strongly on the right channels than on the left channels. I immediately thought there is an issue with the equipment, and so I tried the measurements on two other Beograms that were in fully restored condition. And the result did not change. One hypothesis for explaining this phenomenon may be that the tracks are curved, i.e. they have an outer and an inner edge which contain the information for one or the other channel...but that is a topic for another post. The good news is that at or below 0 VU this difference is not significant and it only plays a role at very high amplitudes.
Allright, time to put the working cartridges to some exciting listening use instead of boring them with 333 Hz and 1 kHz test tones....;-)


Sunday, November 13, 2016

Testing B&O MMC Cartridges with a QuantAsylum QA400 and Test Records

A while ago I agreed to try and qualify a few B&O cartridges. I received a MMC20EN, a MMC4000, and a MMC6000 in the mail. For comparison I added a MMC20CL to the test line-up for comparison. The CL came along with the Beogram 8000 that I just restored. In fact, I used this 8000 for this test. The setup was as follows:

I connected the Beogram 8000 directly to the inputs of a QuantAsylum QA400 audio analyzer which was hooked up to a PC. The QA400 can reliably work with signals down to -130dBV, which is an ample range for measuring moving magnet cartridges, which typically emit a signal in the -50dBV (~3-4mV) range at the highest volume of a vinyl record.

I used a Analogue Audio Test LP for the channel separation, direct frequency response values and the pink noise spectra. For measuring the frequency response at higher frequencies I employed a "TheFisher Test LP" for CD-4 set-ups. This LP has some test tracks that play the -70dBV 30kHz carrier tone for the rear channels of CD-4 records. This allowed the measurement of at least one solid datapoint beyond the 20kHz range (where the Analogue record seems to end).

This graph shows the pink noise spectrum of the cartridges:

The amazing item about this graph is that all four cartridges yielded pretty similar spectra. The steep cutoffs at 20kHz are a result of the fact that the pink noise track of the Analogue Audio record seems to cut out at 20kHz, i.e. the pink noise does not contain frequencies above 20kHz. The only difference between the cartridges is that all of them except the MMC 20 CL showed a ~2-3dB difference between the left and right channels (which I believe is a difference that is hard to discern when listening to music).

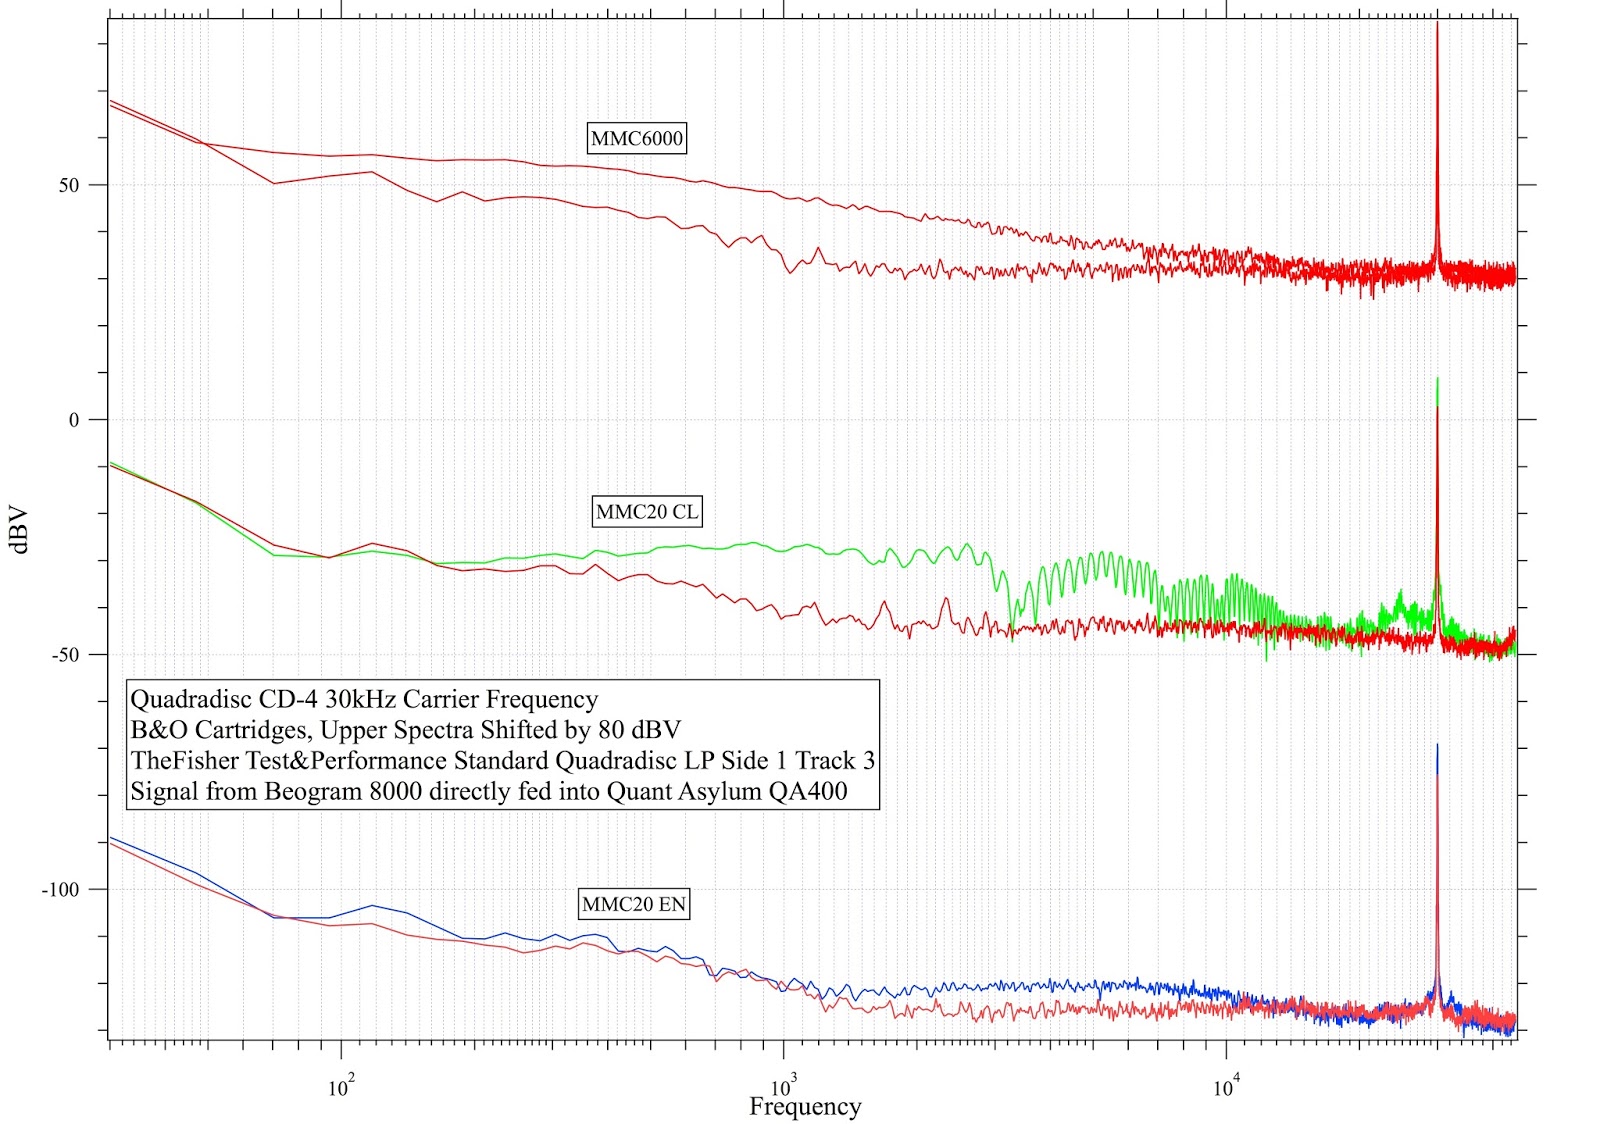
These are the spectra measured with the TheFisher LP:
The narrow peak on the right end of the graphs is the 30kHz carrier peak of the CD-4 signal. CD-4 essentially uses frequency modulation (FM) of this carrier signal to encode the back channels. This can be seen directly when the rear signal contains an audio signal. In this case the narrow peak widens reflecting the modulated frequency spectrum. The spectra shown here were measured on a track that only contained the back channels, and during a quiet moment of that channel (so only the carrier frequency was present).
Again, the amazing item is that the 20CL, the EN and the 6000 show a very similar behavior. All peaks come in at about -70 dBV, which is very reasonable, considering that the carrier is supposed to be -20 dBV (=1/10th of the voltage of the regular 0VU signal of the front channels) below the front channels at full volume (0 VU = -50dBV).

While these spectra are helpful to decide whether a cartridge is in good condition or not, they are not equivalent to a 'real' frequency response curve. Unfortunately, there seems to be no way to do such a measurement with the QA400 since it cannot detect an external input frequency and then measure the transfer function of that signal. This means that the frequency sweeps on the Analogue Test LP must be used with manual readout if a glimpse is sought into the real frequency dependent output levels of a cartridge.
This table shows the measurements I made:


the 1 kHz response was measured using the first track on the first side of the record. It simply plays a 1 kHz tone at full 0 VU. This yielded values of about 3-4mV (corresponding to dBV values around -50 dBV). The separation was measured on Tracks 2/3 and the values represent the dBV difference between the on and the off channel.

Then I used Tracks 6 and 7 which are a 1-20kHz sweep in 1kHz steps at -20 dBV relative to 0VU and a 1 kHz - 100Hz sweep in 100 Hz steps at 0VU (the 100Hz values are adjusted to the -20dBV scale to match the other values). The dBV values are the amplitudes of the main peak at these frequencies. It is obvious that all cartridges have a stronger response at higher frequencies than at lower ones. Considering that the pink noise spectrum varies in the opposite way by about -20dBV from 20 -20000 Hz, the (relatively flat) pink noise spectra roughly agree with these values.

In conclusion, it appears that all four cartridges have a very similar frequency response. This is somewhat surprising in the light of how these cartridges were marketed for different applications and listening tasks.