A while ago I agreed to try and qualify a few B&O cartridges. I received a MMC20EN, a MMC4000, and a MMC6000 in the mail. For comparison I added a MMC20CL to the test line-up for comparison. The CL came along with the Beogram 8000 that I just restored. In fact, I used this 8000 for this test. The setup was as follows:
I connected the Beogram 8000 directly to the inputs of a QuantAsylum QA400 audio analyzer which was hooked up to a PC. The QA400 can reliably work with signals down to -130dBV, which is an ample range for measuring moving magnet cartridges, which typically emit a signal in the -50dBV (~3-4mV) range at the highest volume of a vinyl record.
I used a Analogue Audio Test LP for the channel separation, direct frequency response values and the pink noise spectra. For measuring the frequency response at higher frequencies I employed a "TheFisher Test LP" for CD-4 set-ups. This LP has some test tracks that play the -70dBV 30kHz carrier tone for the rear channels of CD-4 records. This allowed the measurement of at least one solid datapoint beyond the 20kHz range (where the Analogue record seems to end).
This graph shows the pink noise spectrum of the cartridges:

The amazing item about this graph is that all four cartridges yielded pretty similar spectra. The steep cutoffs at 20kHz are a result of the fact that the pink noise track of the Analogue Audio record seems to cut out at 20kHz, i.e. the pink noise does not contain frequencies above 20kHz. The only difference between the cartridges is that all of them except the MMC 20 CL showed a ~2-3dB difference between the left and right channels (which I believe is a difference that is hard to discern when listening to music).
These are the spectra measured with the TheFisher LP:
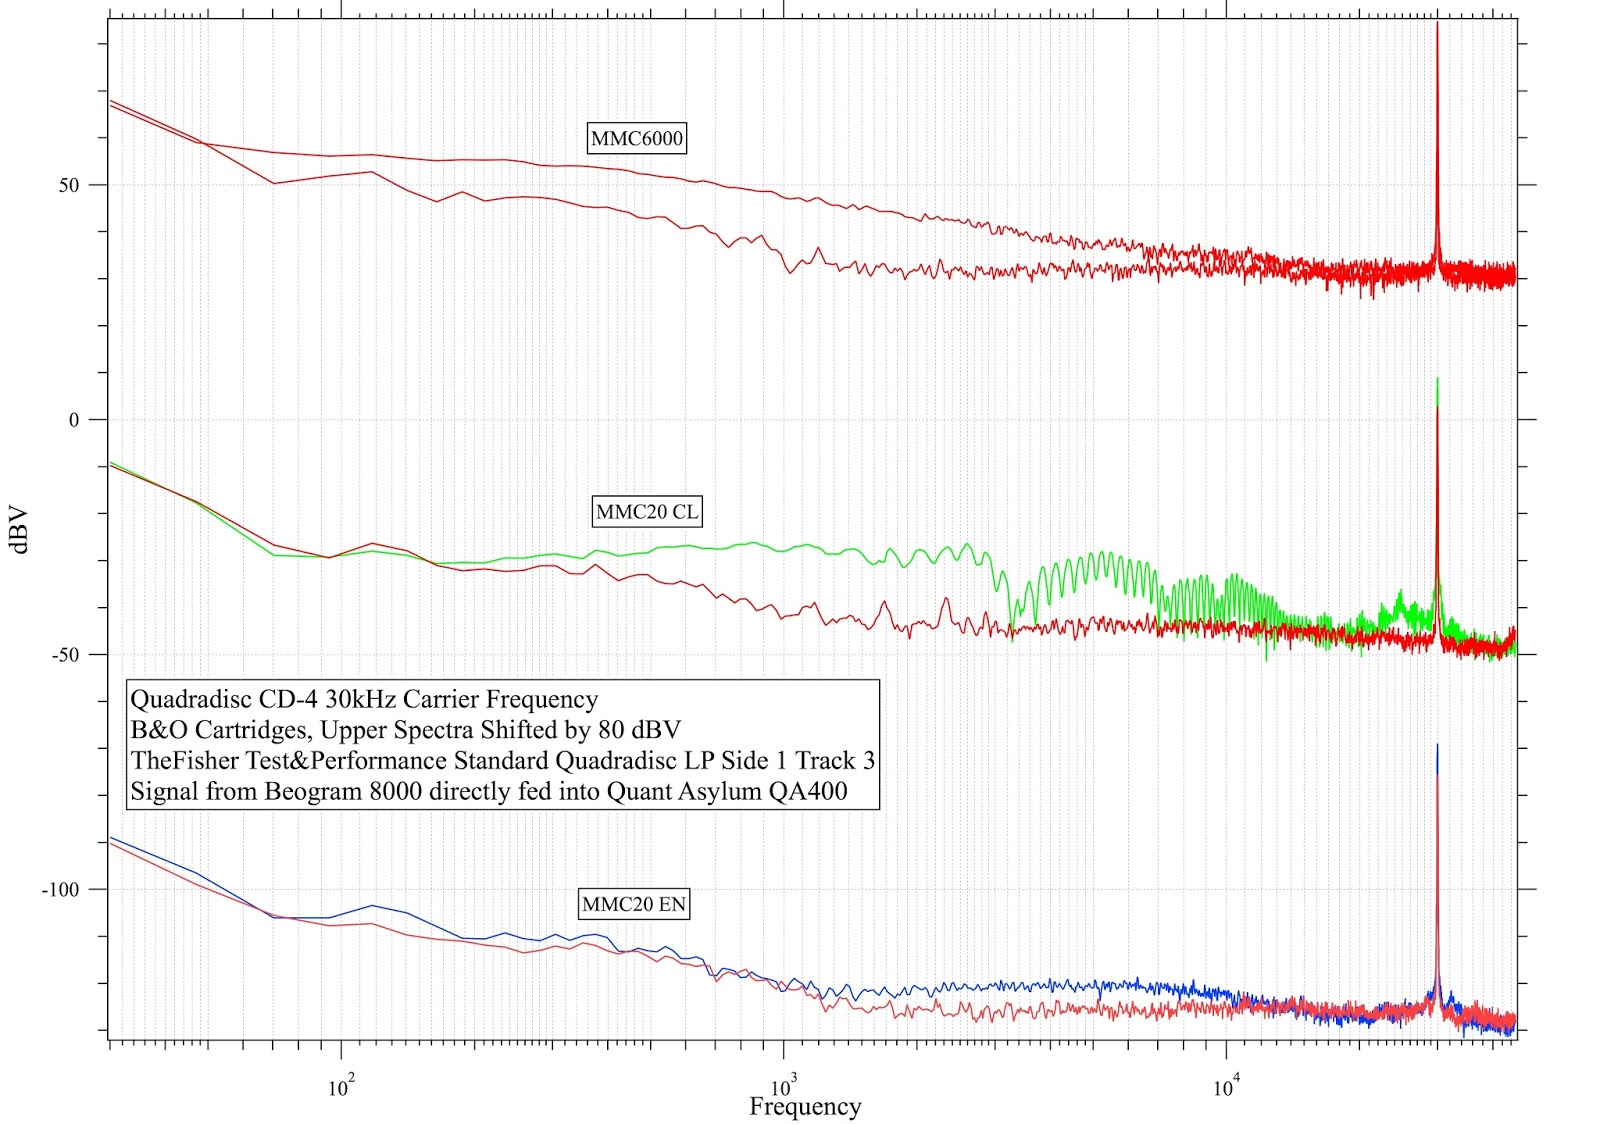
The narrow peak on the right end of the graphs is the 30kHz carrier peak of the CD-4 signal. CD-4 essentially uses frequency modulation (FM) of this carrier signal to encode the back channels. This can be seen directly when the rear signal contains an audio signal. In this case the narrow peak widens reflecting the modulated frequency spectrum. The spectra shown here were measured on a track that only contained the back channels, and during a quiet moment of that channel (so only the carrier frequency was present).
Again, the amazing item is that the 20CL, the EN and the 6000 show a very similar behavior. All peaks come in at about -70 dBV, which is very reasonable, considering that the carrier is supposed to be -20 dBV (=1/10th of the voltage of the regular 0VU signal of the front channels) below the front channels at full volume (0 VU = -50dBV).
While these spectra are helpful to decide whether a cartridge is in good condition or not, they are not equivalent to a 'real' frequency response curve. Unfortunately, there seems to be no way to do such a measurement with the QA400 since it cannot detect an external input frequency and then measure the transfer function of that signal. This means that the frequency sweeps on the Analogue Test LP must be used with manual readout if a glimpse is sought into the real frequency dependent output levels of a cartridge.
This table shows the measurements I made:

the 1 kHz response was measured using the first track on the first side of the record. It simply plays a 1 kHz tone at full 0 VU. This yielded values of about 3-4mV (corresponding to dBV values around -50 dBV). The separation was measured on Tracks 2/3 and the values represent the dBV difference between the on and the off channel.
Then I used Tracks 6 and 7 which are a 1-20kHz sweep in 1kHz steps at -20 dBV relative to 0VU and a 1 kHz - 100Hz sweep in 100 Hz steps at 0VU (the 100Hz values are adjusted to the -20dBV scale to match the other values). The dBV values are the amplitudes of the main peak at these frequencies. It is obvious that all cartridges have a stronger response at higher frequencies than at lower ones. Considering that the pink noise spectrum varies in the opposite way by about -20dBV from 20 -20000 Hz, the (relatively flat) pink noise spectra roughly agree with these values.
In conclusion, it appears that all four cartridges have a very similar frequency response. This is somewhat surprising in the light of how these cartridges were marketed for different applications and listening tasks.
No comments:
Post a Comment
Comments and suggestions are welcome!